Table of Contents
Working with Boards - Reckon Insights
Working with Boards
Whether it be your own favourite collection of charts and reports, the set of dashboards discussed in regular meetings, visualisations pulled together for a client consultation, or a quick scratch-pad collection to share with a colleague for immediate discussion, Boards are a great way to collate content into one place, and also a way those with a Viewer licence can assemble and share content.
You can have as many boards as you need. Simply create a board, name it, then add whatever visualisations you want to it.
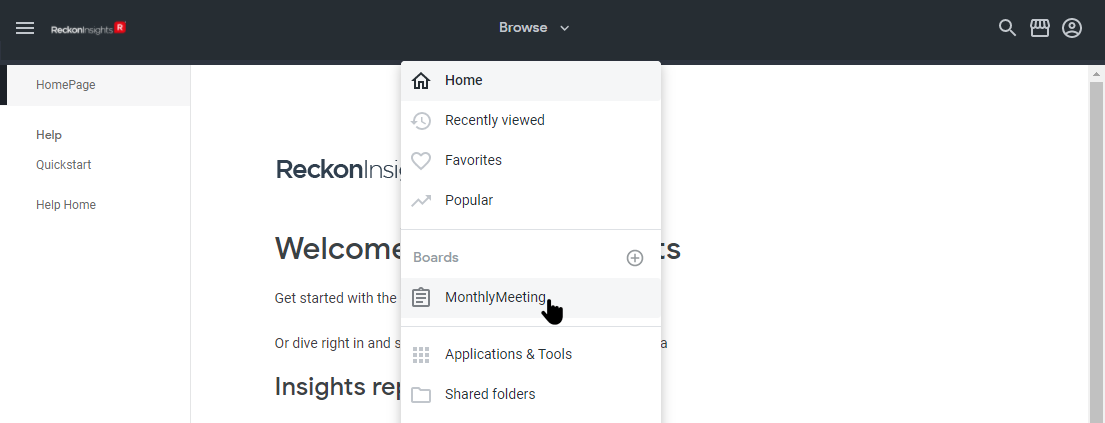
Boards are found in the Boards section of the Browse Menu, and also in the left-pane, once you have navigated away from the Home page.
Existing Boards
Selecting
Existing Boards can be selected from the Boards section of the Browse Menu.
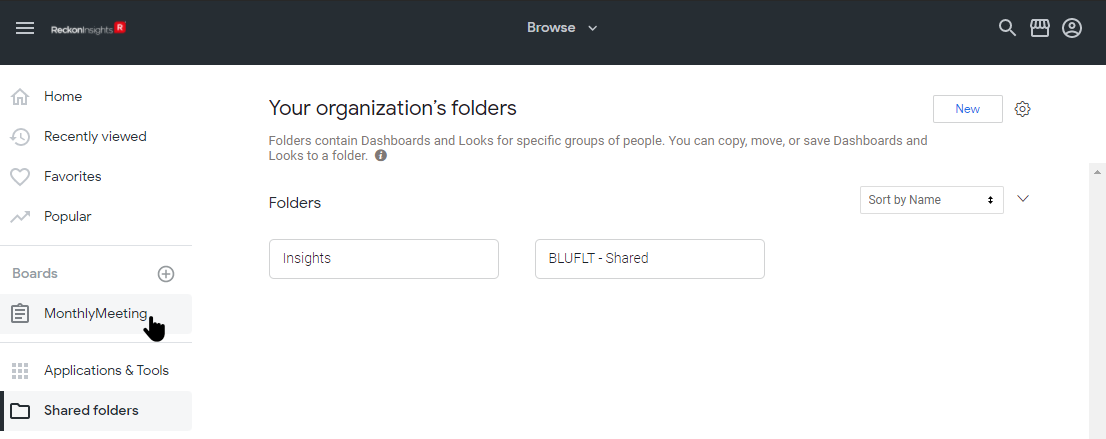
Existing Boards also can be selected from the left-pane, once you have navigated away from the Home page.
Searching
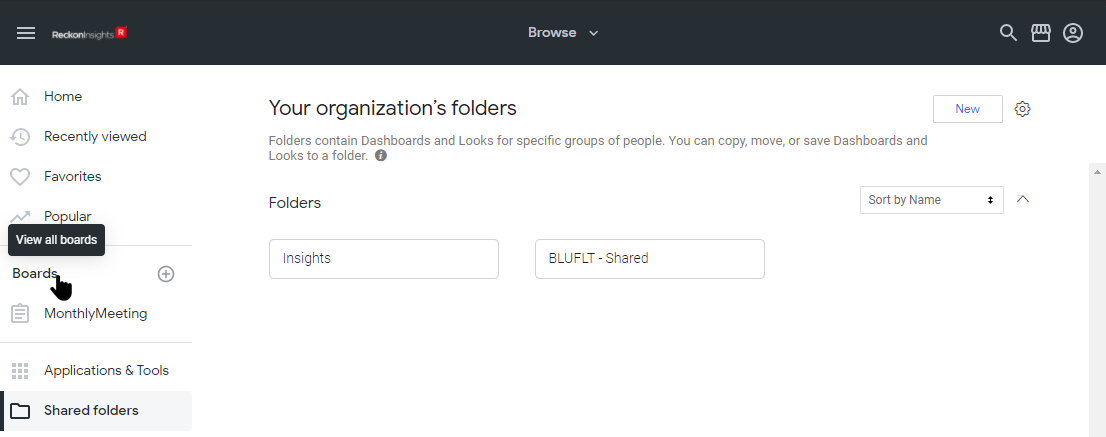
Boards can be searched for by clicking on the Boards section-heading, in either the Browse menu...
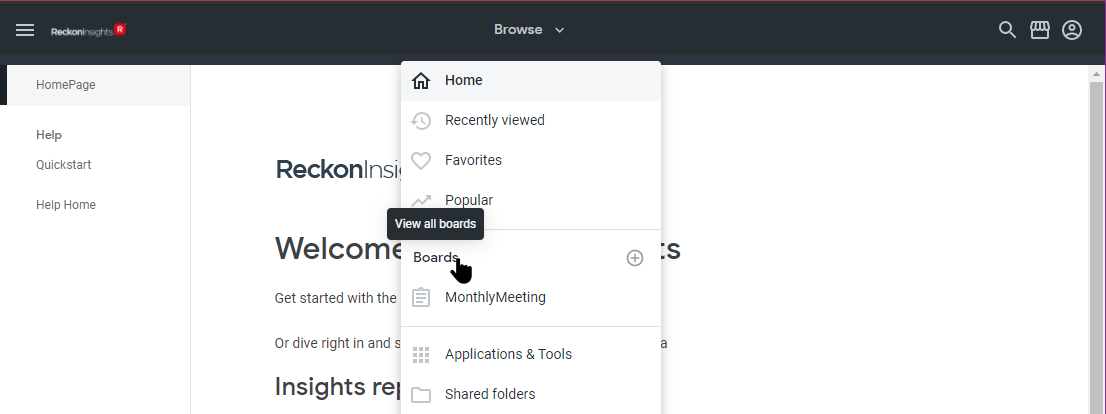
Or the left-pane, to View all boards.
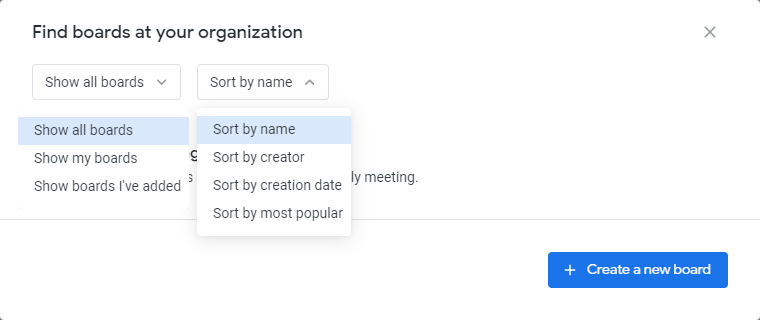
This pops up a search criteria dialog that enables some filtering and sorting criteria (both menus shown). Note that Boards can also be created from this dialog.
Creating a Board
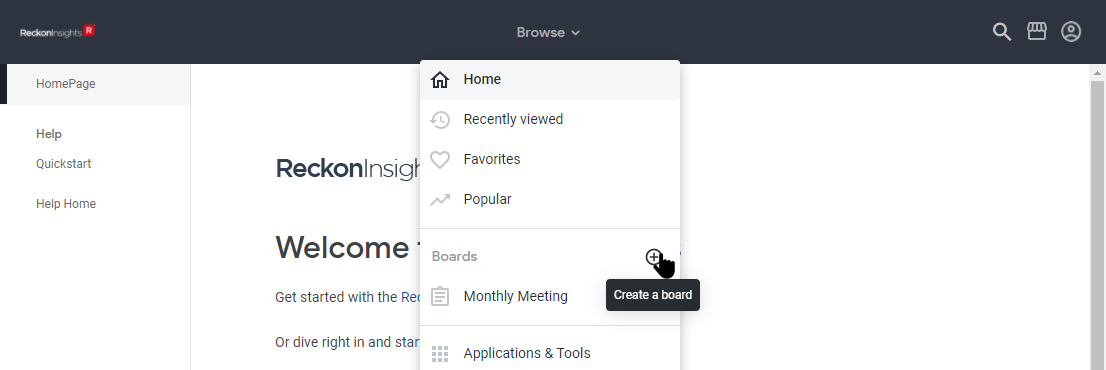
Boards can be created from the Boards section of both the Browse menu and the left-pane, by clicking on the circled plus symbol (+) next to the Browse section heading. This is especially handy when no boards have been created yet. Boards can also be created from the Find boards at your organisation dialog, simply click on the blue Create a new board button (see above).
Whichever is clicked, a dialog opens to name the new Board, with the default name of New board.
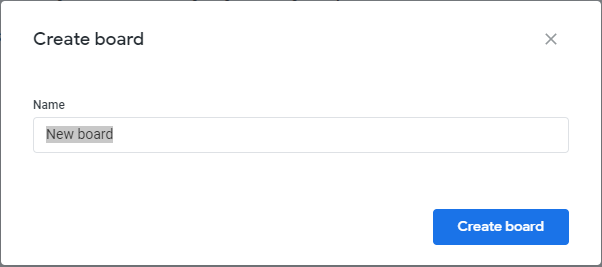
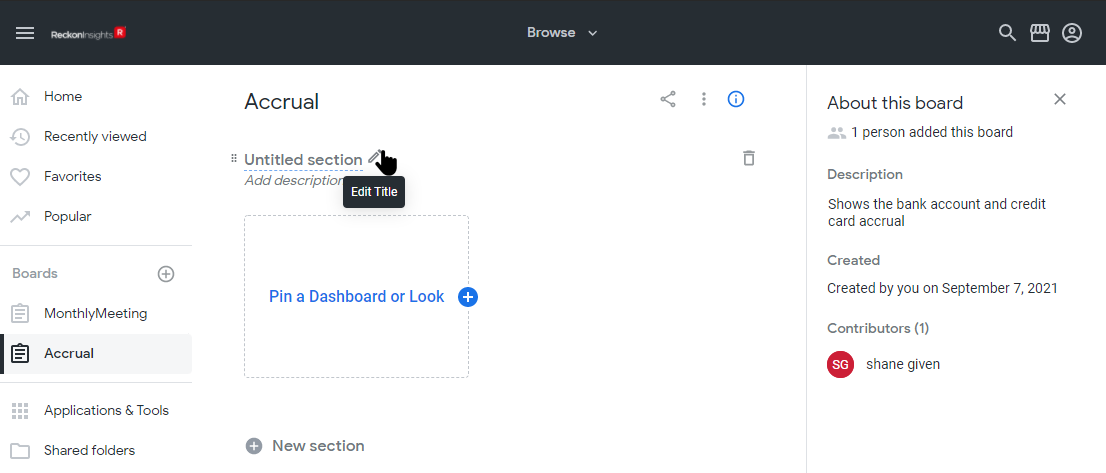
Name the Board appropriately and click Create board. This name can be changed by hovering the pointer near the Board title, which causes a pencil to be displayed. Click on the pencil to edit the Board title.
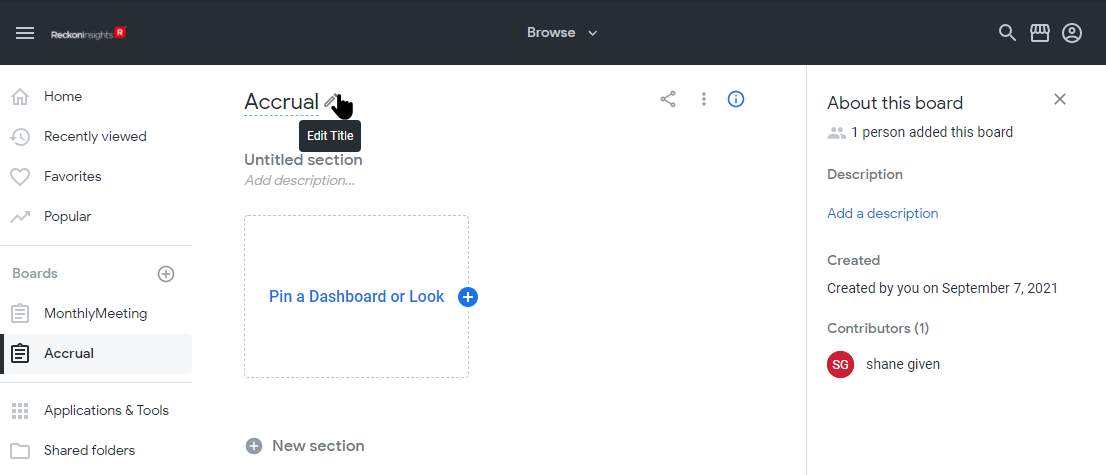
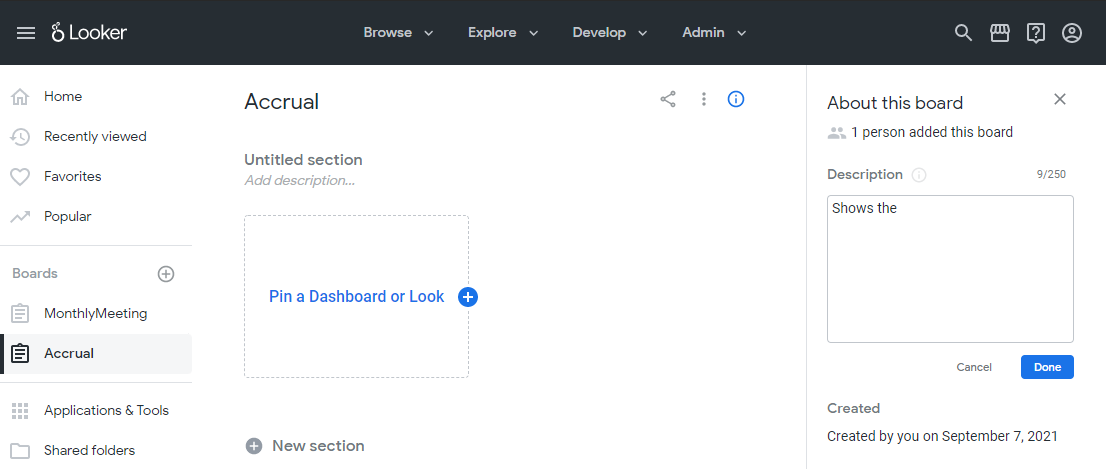
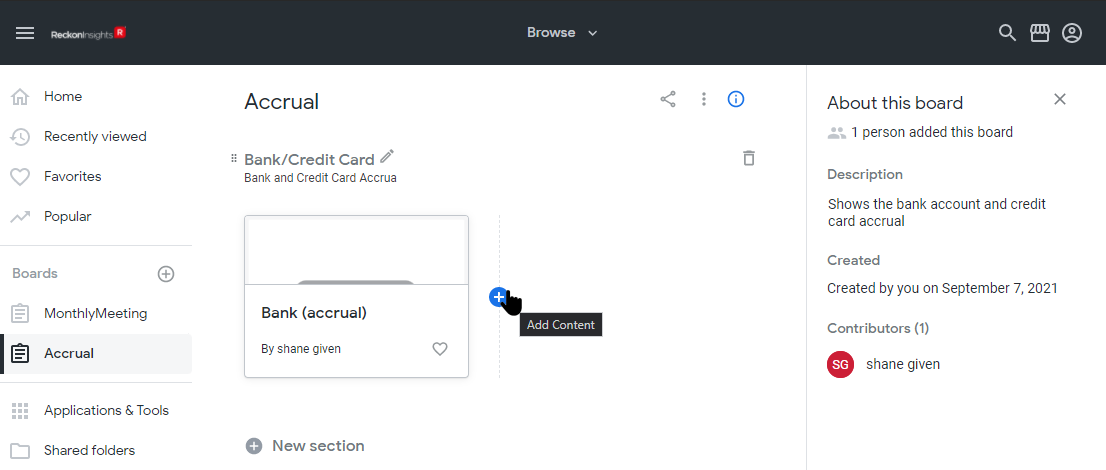
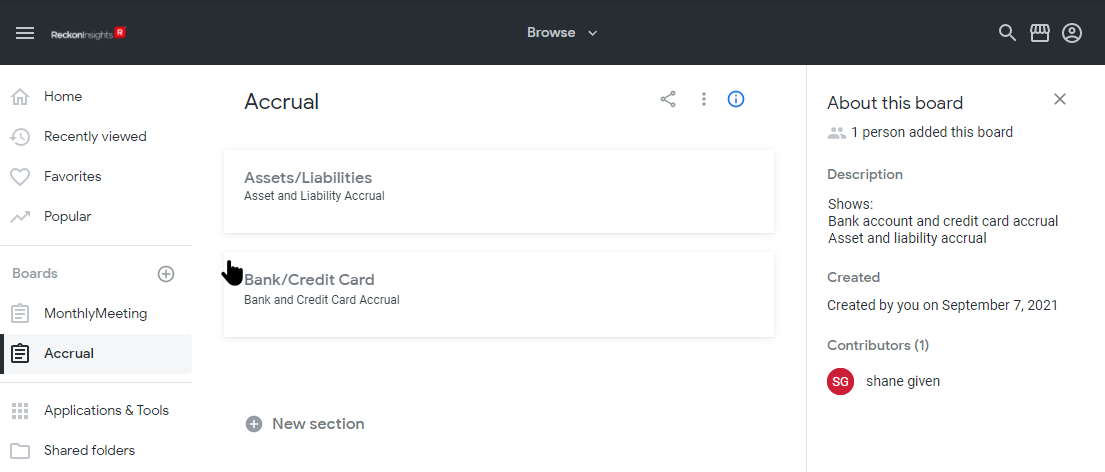
A description for the whole Board can be added in the Boards About this board information pane on the right. This pane is open when the Board is opened, and can be closed by clicking the X to the right of About this board. The pane can also be toggled open and closed by clicking on the information symbol (the circled i).
Click on Add a description in the right pane, and type a description for the whole board.
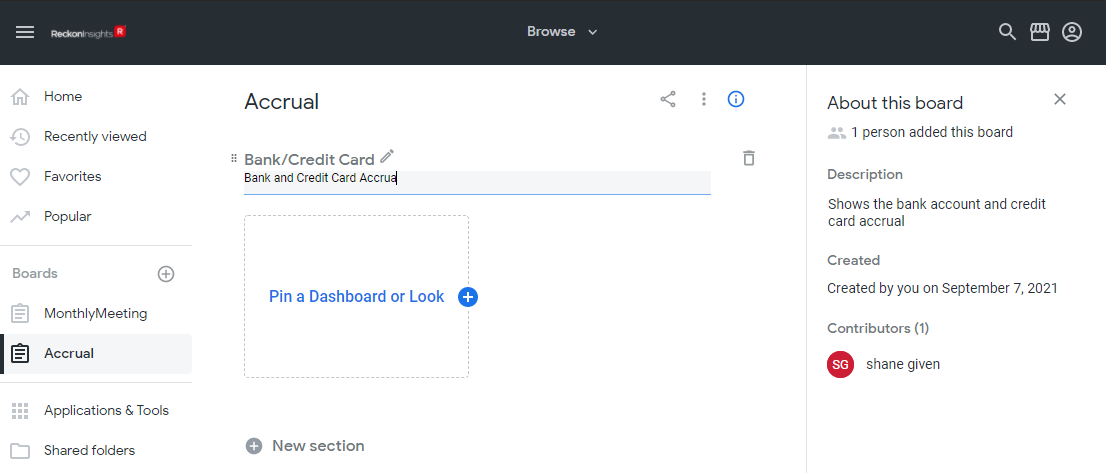
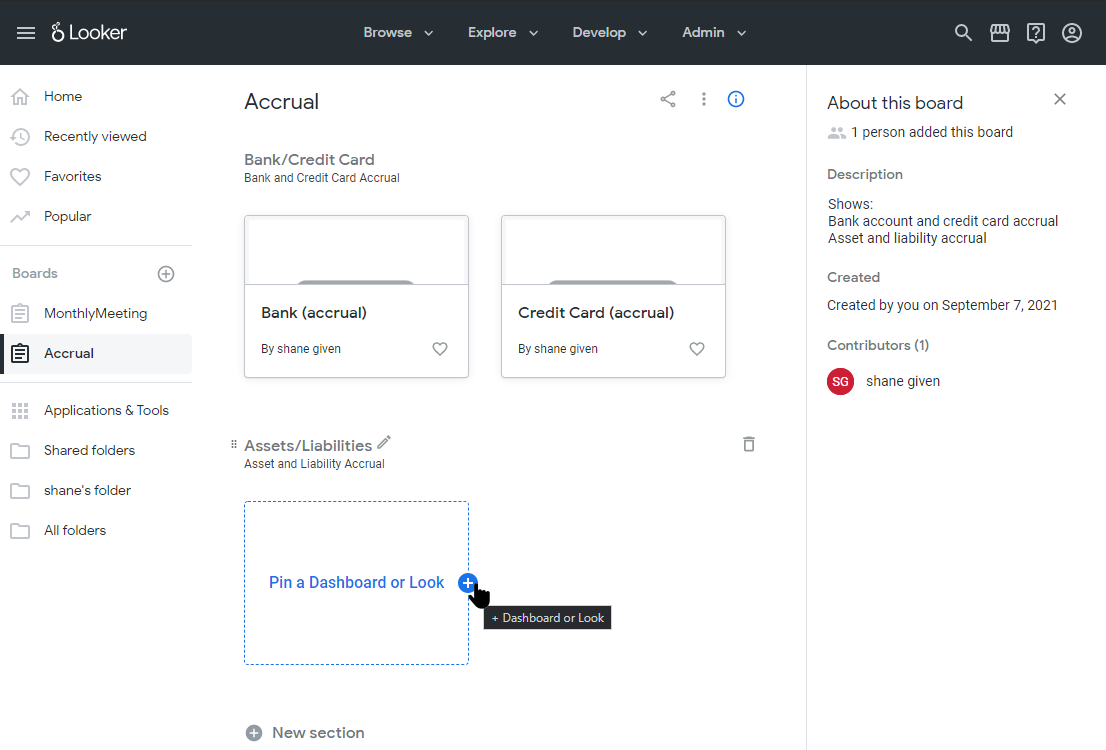
Hovering the pointer near the section title Untitled section also displays a pencil beside it, as well as the 6-dot grab-handle with which the section can be dragged and dropped. Click on the pencil to edit the section title. Directly below the section title, there is a place to add a description if desired. Click on Add description... and type a short description for this section.
Adding content
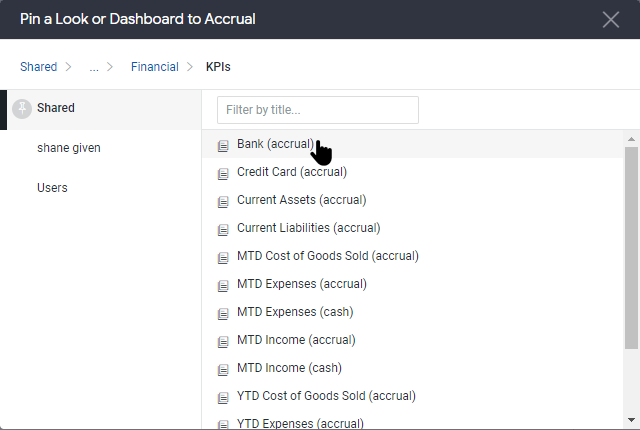
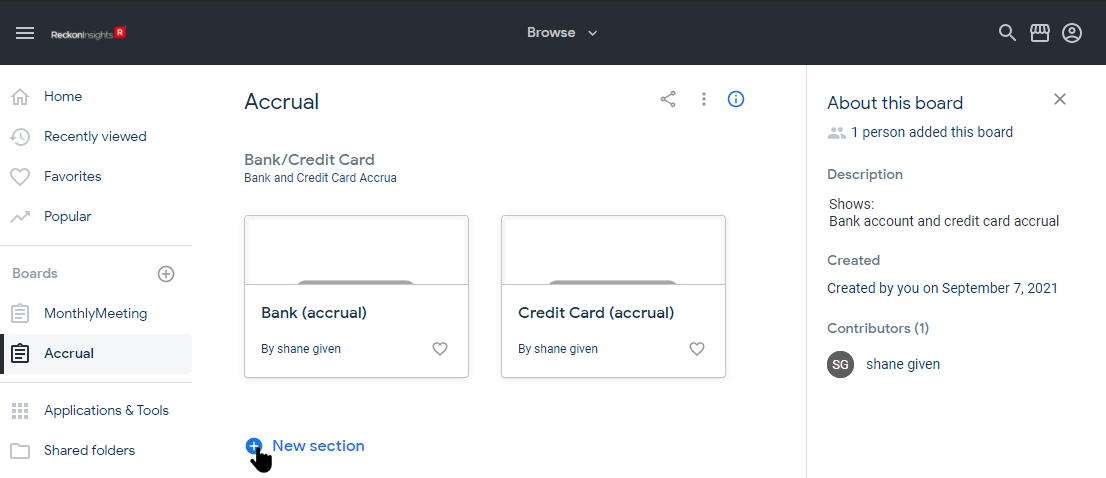
From the dashboard itself you add content by clicking the blue circle with plus sign beside Pin a Dashboard or Look. This opens the dialog from which you can navigate to the visualisations you want to pin to this section of the board.
Once you have added content to a section, you can add more content by clicking the circle with plus sign, which will be displayed whenever the pointer is hovering over the section. The same dialog above opens for you to select another visualisation.
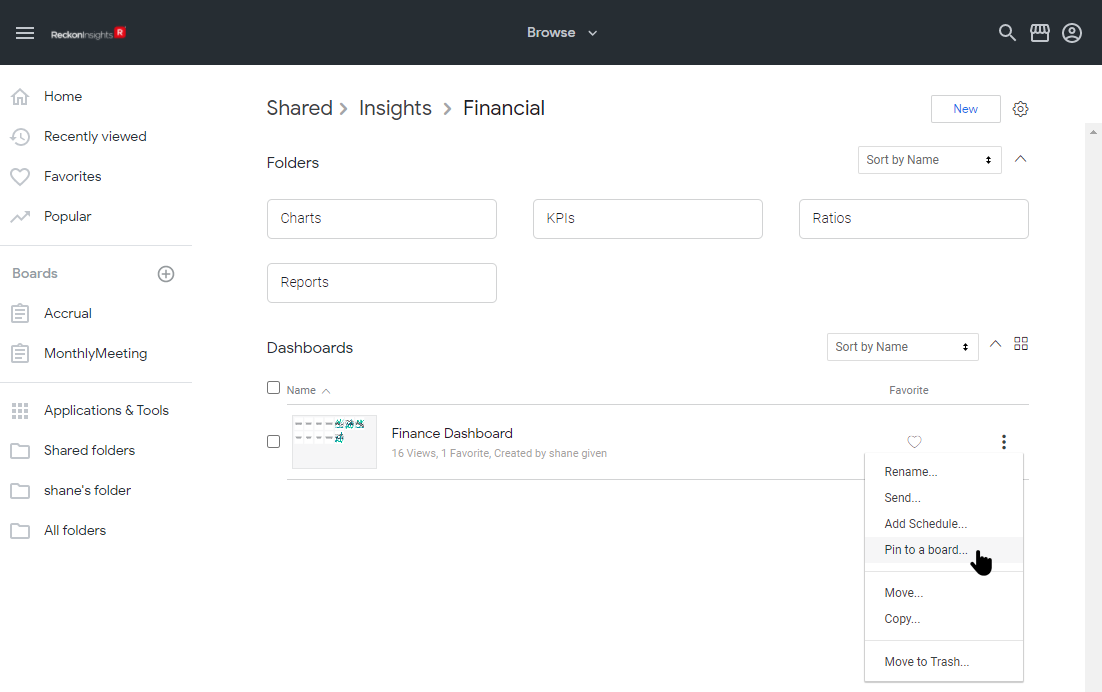
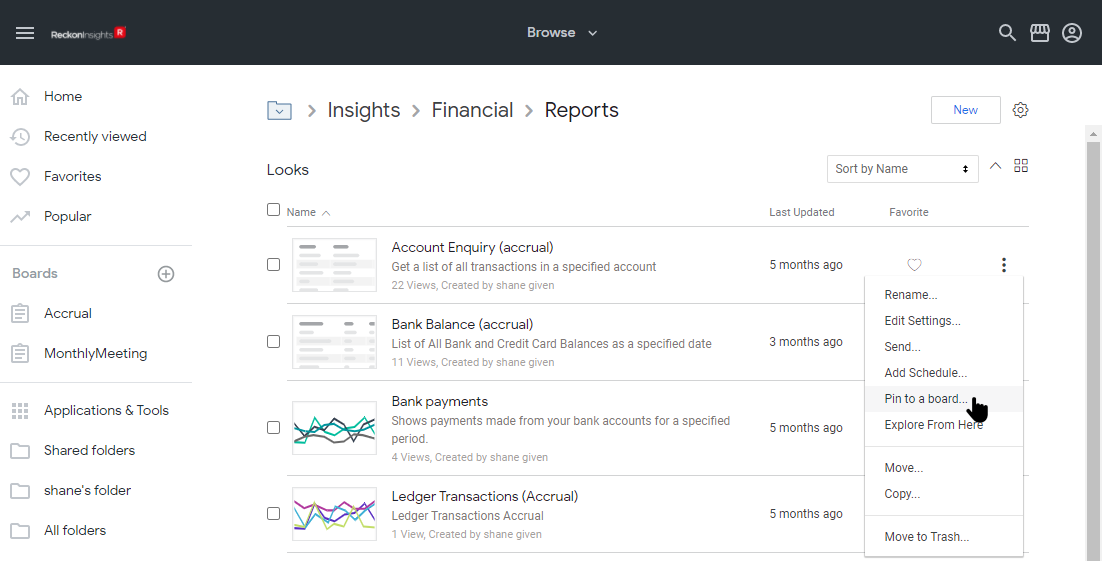
As well as adding content to a board from within the board itself, content can also be added from Dashboards and individual visualisations, either from the folder they are in, or while viewing them.
In the folder, click on the ellipsis button of the dashboard or visualisation, and select Pin to a board.
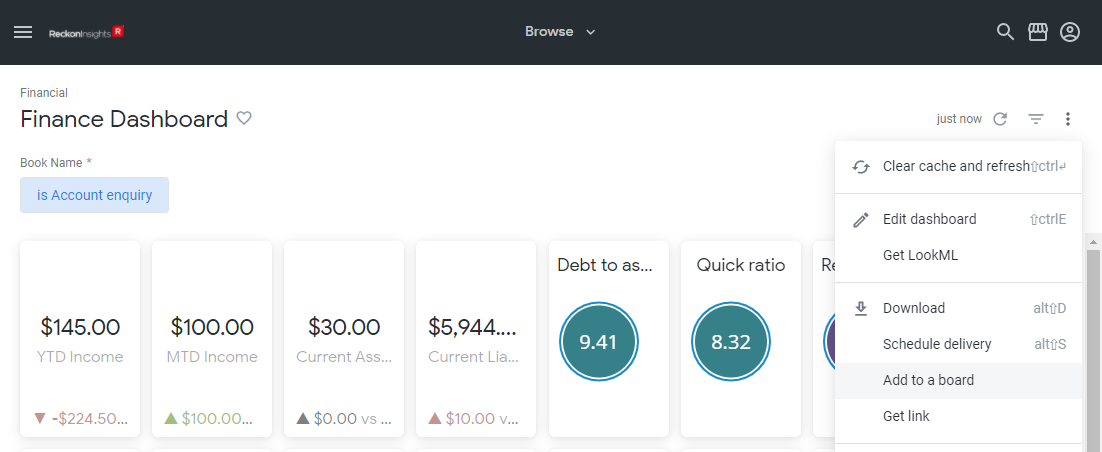
In the dashboard click on the the ellipsis button and select Add to a board.
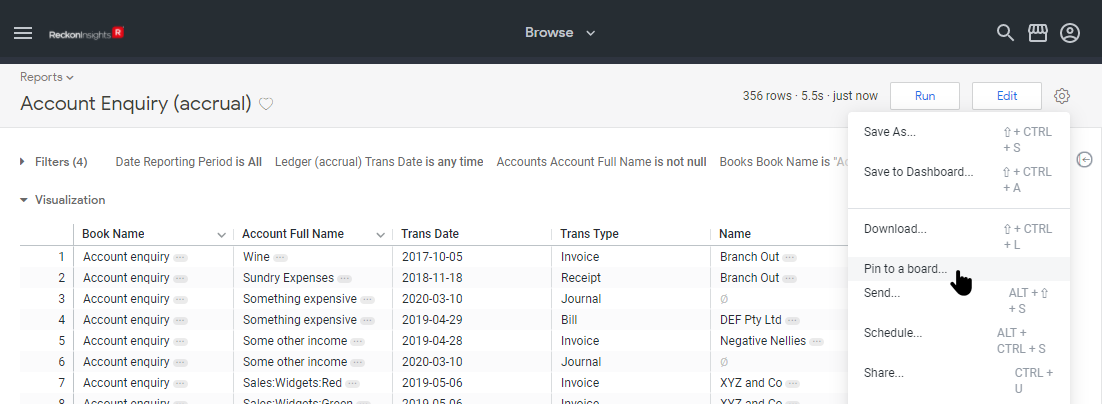
In the visualisation, click on the the cog button and select Pin to a board.
Deleting content
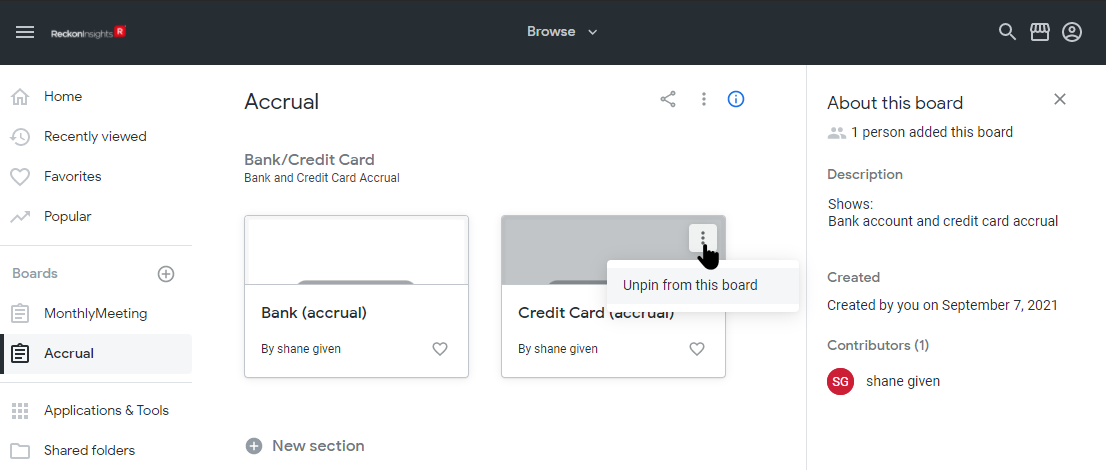
You can easily unpin individual visualisations via their ellipses menu, and then add different ones. Simply click the ellipsis button, then Unpin from this board, to remove a visualisation from the Board.
Moving content
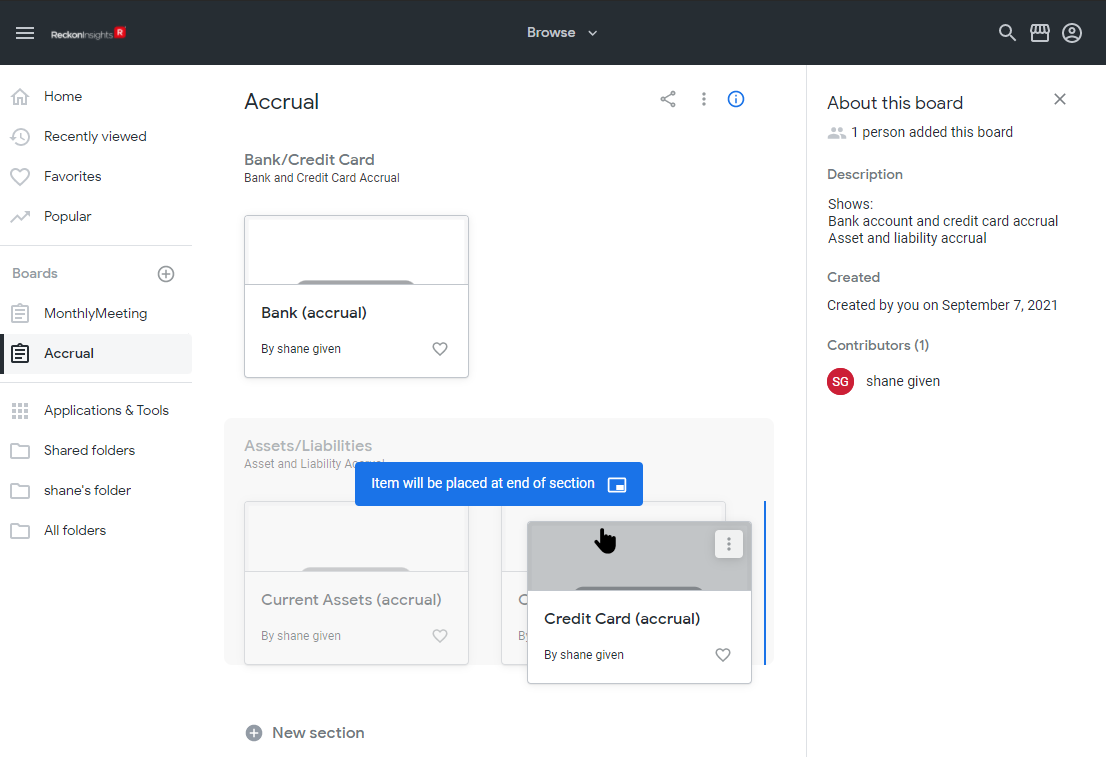
Individual visualisations can be dragged and dropped into new positions in the same or different sections of the board, simply click on the visualisation and drag it where desired. If dragging between sections the visualisation will be moved to the end of the section.
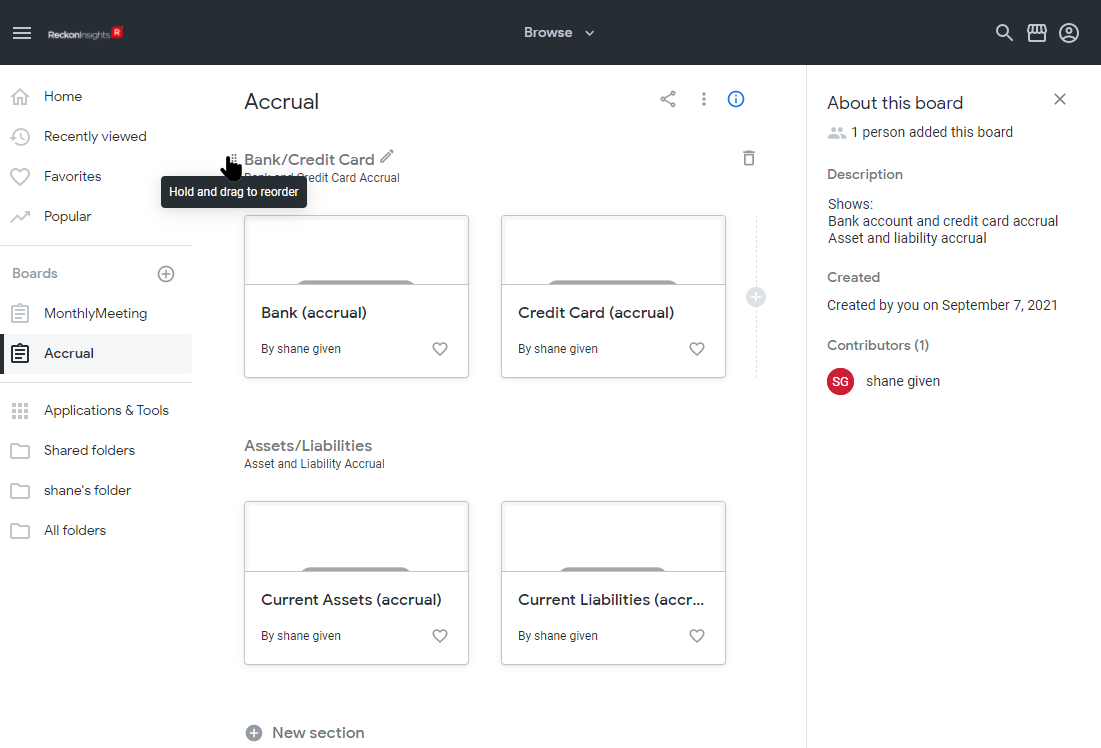
Entire sections can also be dragged and dropped. Hover the pointer over the section title so the 6-dot grab-handle appears, then click on it and drag the section where desired.
Adding and working with Sections
While you can keep adding content to the same section, creating new sections to group related information makes the Board more understandable.
Click the circle with plus sign before New section to add and name a new section.
Visualisations can now be added to this section in the same way just done for the section above.
Sharing and un-sharing Boards
Once you have set up a board, you can share it with other insights users by clicking on the share button to the right of the Board title.
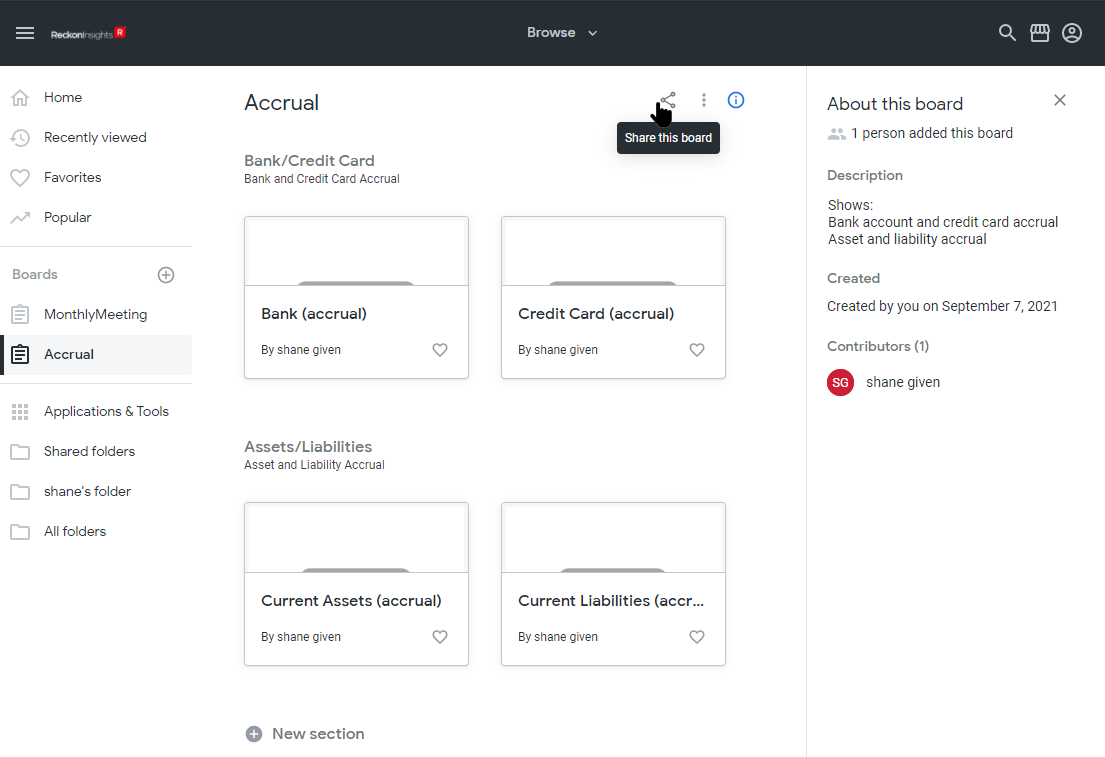
Click on Share this board, which opens the dialog to manage access to the board.
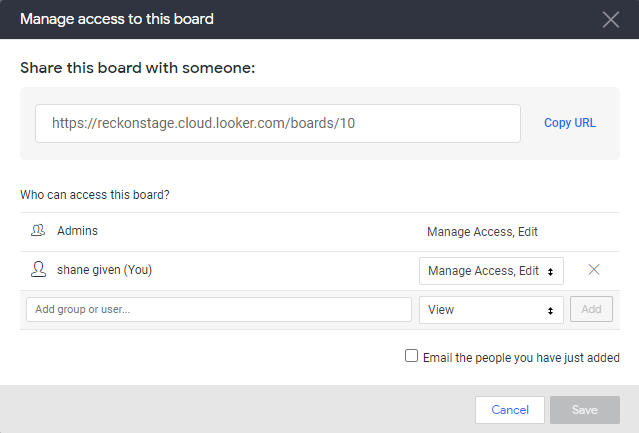
Here access to the board can be granted, or revoked. Click on Add group or user... to bring up the list of User Groups and Users to whom you can grant access to the Board, and select the Group or User to share with.
There are 2 levels of access that can be granted:
- View - Viewing rights only.
- Manage, Access, Edit - Full access.
Click the Add button to grant the individual or group access to the Board.
Now you can either:
- Copy the the Board URL by clicking on Copy URL, and them email the URL to the intended recipient.
- Tick the check-box to Email the people you have just added when the Save button is clicked.
To remove access to the Board (or un-share it) for a user, simply click the X at the right of their row.
Back to Table of Contents - Viewer
Back to Table of Contents - Creator