Table of Contents
Working with Dashboards - Reckon Insights - Creator
Working with Dashboards
Dashboards are a great way to present and work with multiple pieces of information at one time.
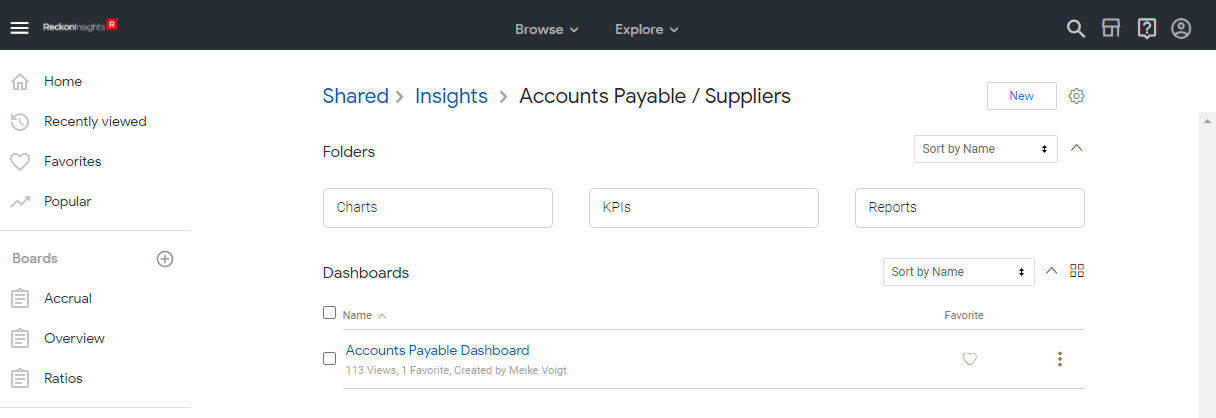
Insight has many default dashboards, and if you have a Creator license, you can build your own based on existing content.
Adding a Dashboard
From a Visualisation
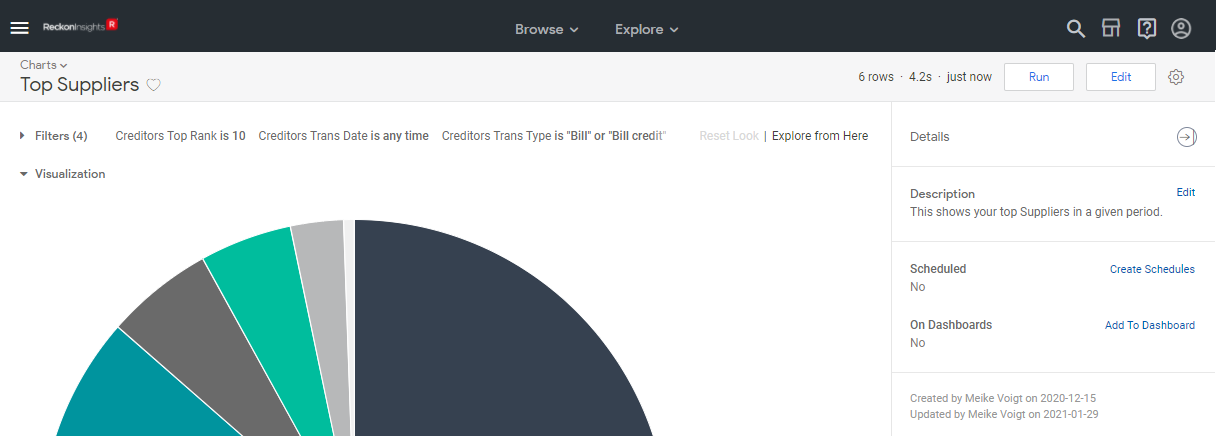
There are number of ways to set up a Dashboard, but the easiest is to start from a visualisation you want to display on the Dashboard, e.g. the Top Suppliers chart.
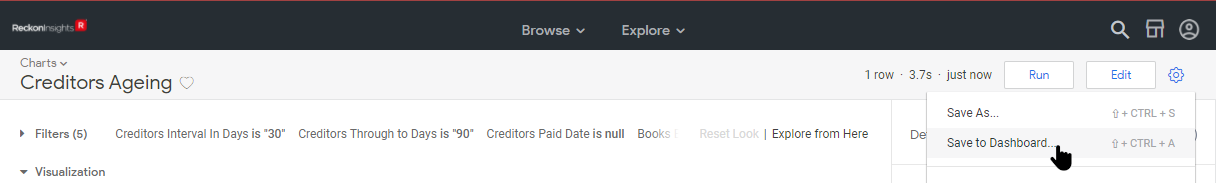
When the visualisation opens, there is a settings cog in the top right, click on this.
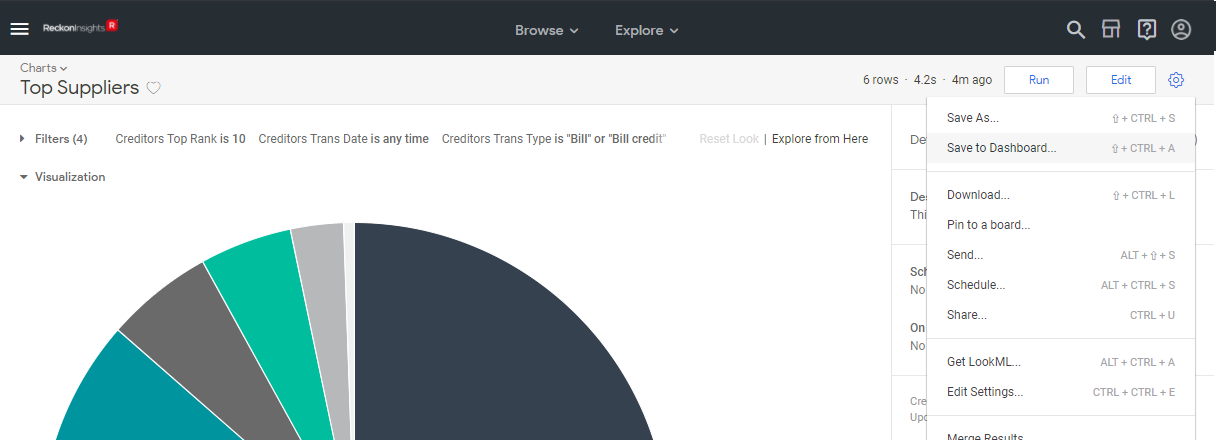
Then in the menu, click on Save to Dashboard..., which opens a new dialog.
This dialog is used to select or create the Dashboard to which the visualisation is to be added.
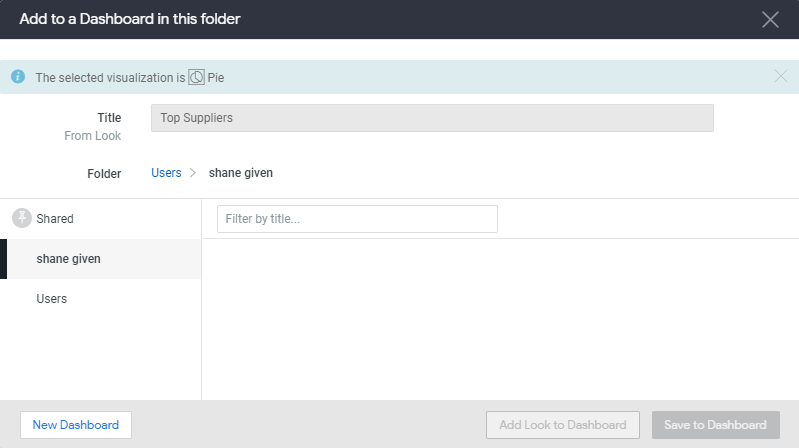
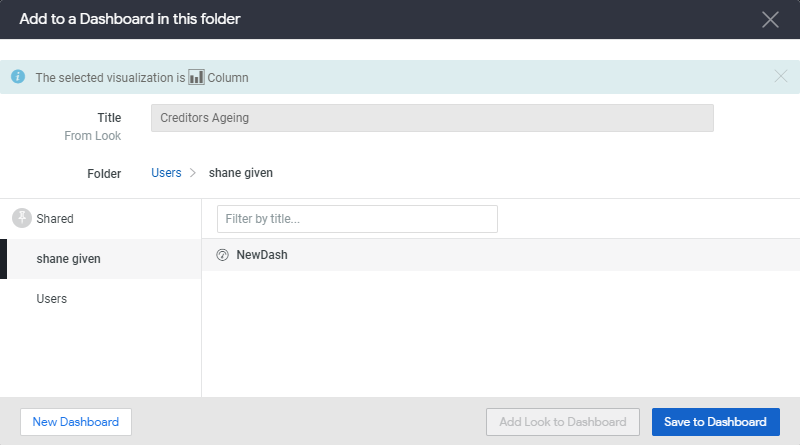
Be sure to select the folder in which you wish to create the dashboard from the left pane, as the default selection is the Shared folder. Your personal folder is the best place to save visualisations and Dashboards you wish to adapt and customise, and is likely the only folder to which you have saving rights.
The visualisation information is across the top, and top-level folders in the the left pane. Select the appropriate folder from the left pane, then choose a sub-folder from the right-pane if desired, then click on New Dashboard.
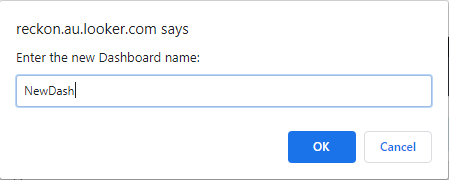
Enter the new Dashboard name and click OK.
Adding more visualisations
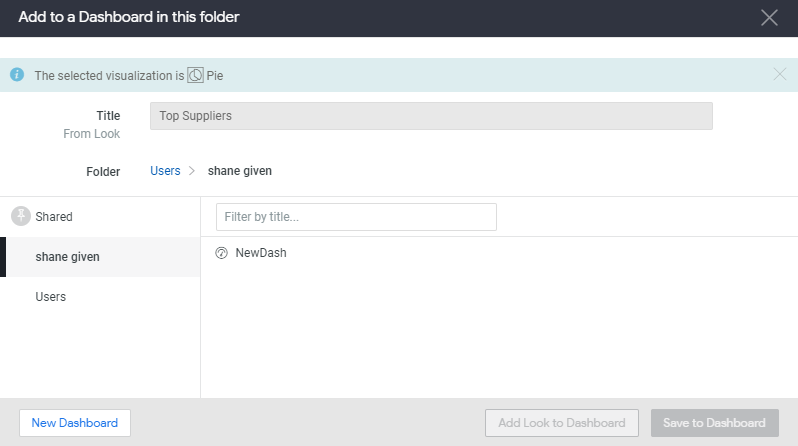
Simply repeat the process for any other visualisations that are to be shown on the same Dashboard. Navigate to the visualisation to be added, click the cog menu and select Save to Dashboard.
Select the correct folder, then select the same Dashboard and click Save to Dashboard.
Once you’ve added all the desired visualisations, open the Dashboard and edit it via the cog menu to move items around, and/or resize them to fit. See Configuring content below.
From your Folder
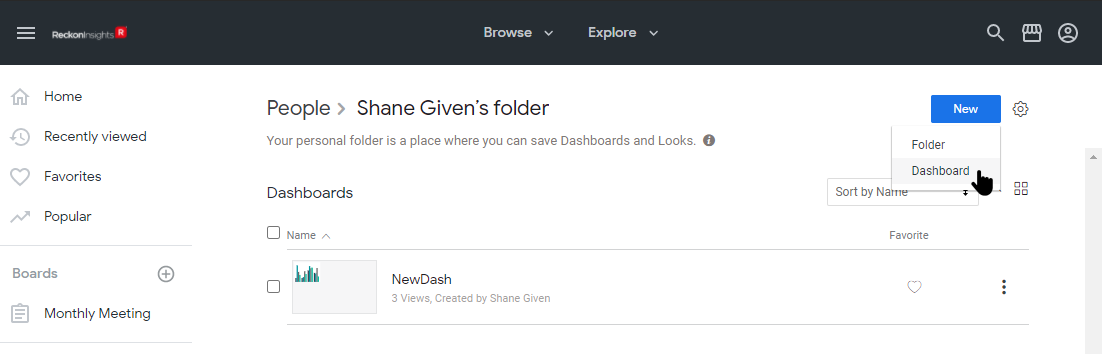
Dashboards can also be added from within your personal folder by clicking the New button at the top right, next to the cog button, and selecting Dashboard.
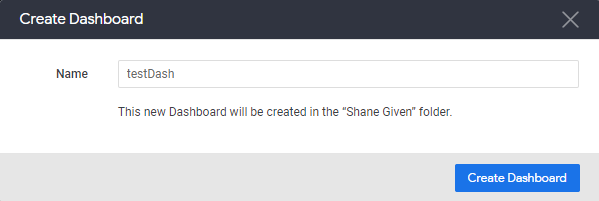
This opens a dialog with which to name the new dashboard. Provide a name and click Create Dashboard.
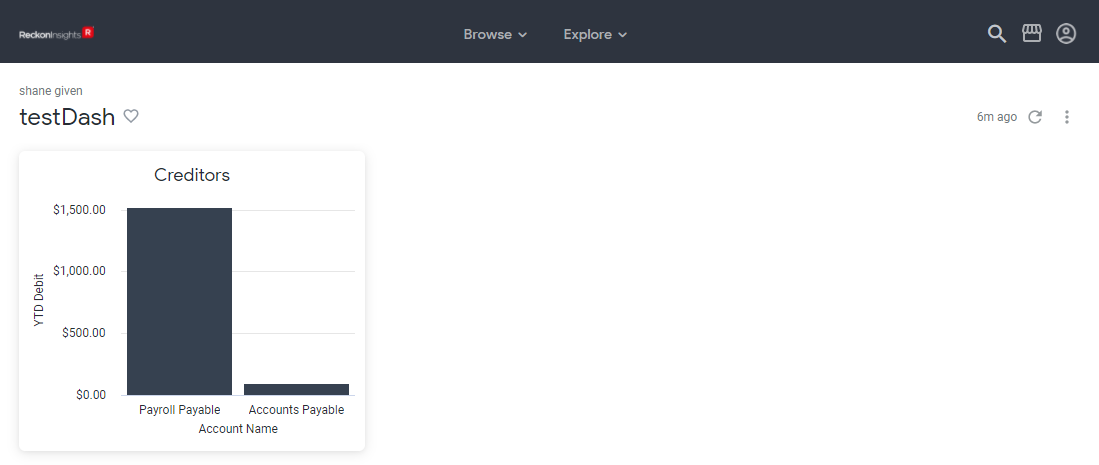
The new blank Dashboard then opens. To make changes to this new Dashboard you must click Edit Dashboard.
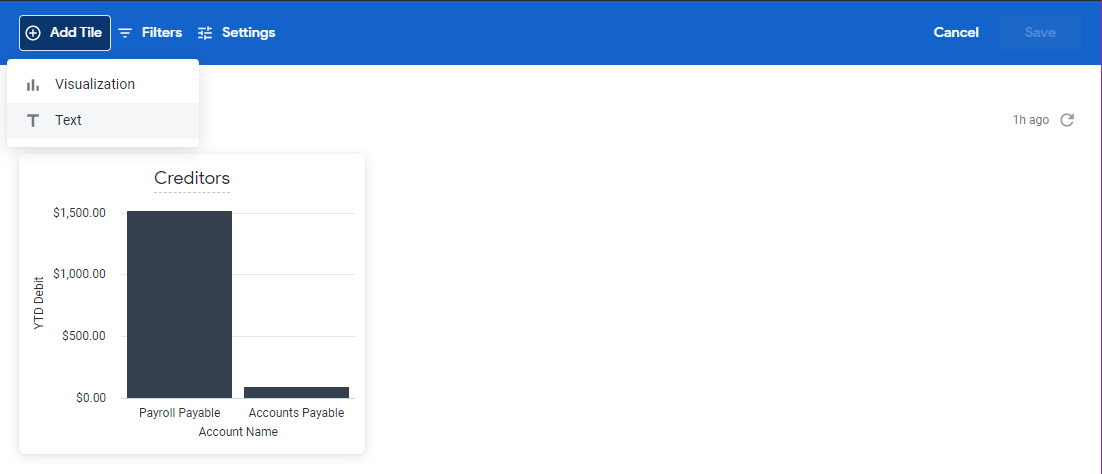
The top bar changes to blue when editing a Dashboard. As well as controls for the adding of content, the Dashboard Filters and Settings controls are displayed, although the Filter control is disabled until there is a Tile on the Dashboard. The dotted-line under the Dashboard name indicates it can be edited, and the Favourite button of the Dashboard is displayed beside the name. Although it looks like there are two Add Tile buttons, the top-left one is actually a menu. The Add Tile button is only present on an empty Dashboard.
Adding content
Visualisations
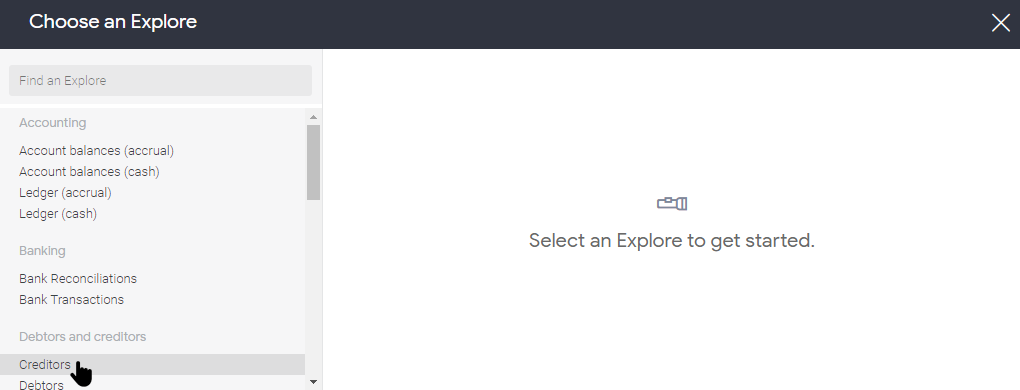
Click on the Add Tile button to add content to your new Dashboard. This opens a dialog from which you can choose the Explore you wish to add content from. Unlike when adding an existing visualisation, when you add a visualisation from an Explore, you must build the content you wish to see. Select the required Explore.
The Edit Tile dialog opens, displaying the chosen Explore. The top of the dialog has controls to Save or Cancel, and to Explore from Here. This opens a new browser tab with just the chosen Explore, i.e. you are no longer editing the Tile. For more details, see Working with Explores.
To start with, change the Tile name from Untitled.
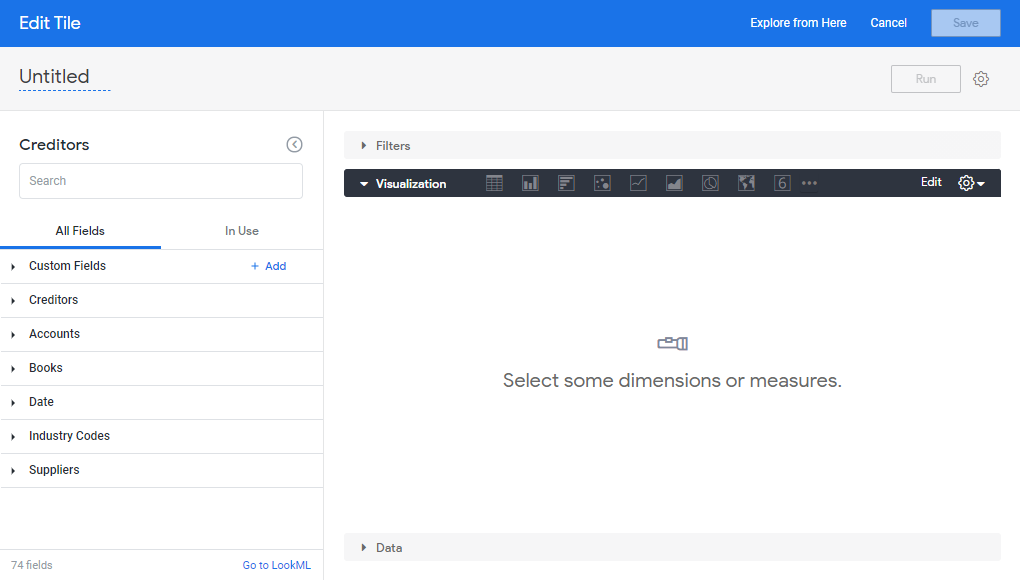
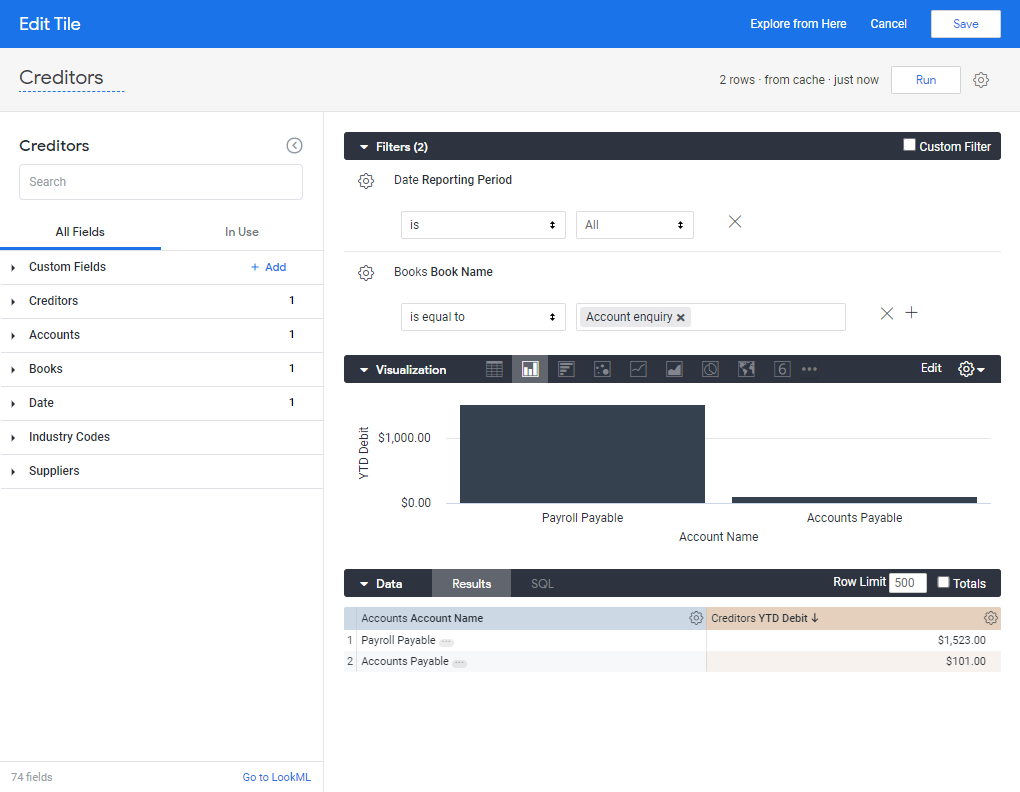
Now you can search for the fields you want in the Search box in the left pane. As you type the fields that match are shown in the All Fields tab below. You can also click the triangles beside the field-names to expand the groupings and show the fields there are in this Explore. There are filter-only fields, dimensions, and measures that can be added to the data and visualisation.
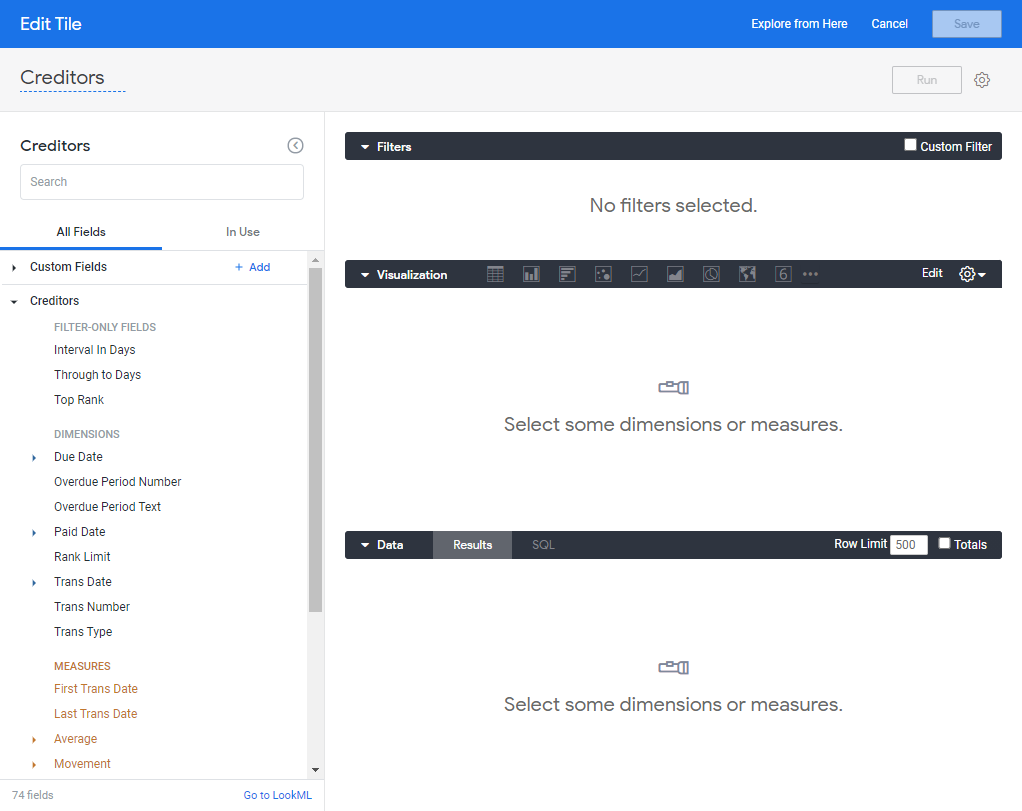
Filter-only fields will only appear in the Filters section when clicked. Default Filter values can be entered, but will be overridden by Dashboard Filters that are on the same field. Tile-level Filters have no Require a filter value setting. This setting can only be applied to Filters added to the entire Dashboard, see Adding Filters below.
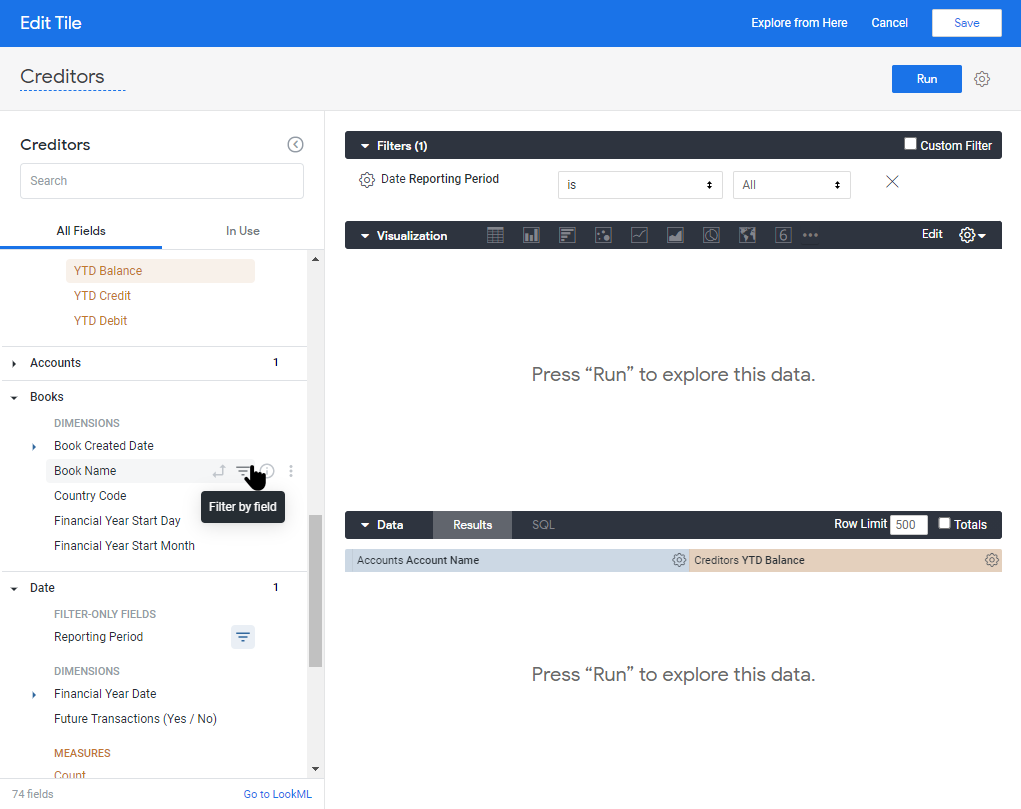
Dimensions and Measures will show up in the data and the visualisation when clicked, but they can be used as Filters by hovering over the field name, then clicking on the Filter by fields button (striped down-arrow) when it shows. Dimensions and Measures used as Filters can also be included in the data by either clicking their name in the left plane, or by clicking the Filters cog menu and selecting Add to table. Clicking the name again, or clicking the Filters cog menu and selecting Remove from table will remove them from the data.
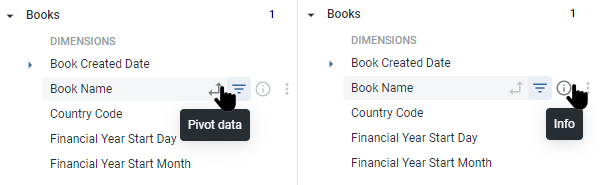
The other buttons that show when hovering over a field are:
The Pivot data button pivots the data on the selected field. The Info button displays some information on the field.
The More ellipsis button displays a list of aggregate fields for Dimensions, which varies depending on the type of data. There is also the Bin option, to define bins to place values into, and the Group option to group results by that field. For Measures there is only the option to filter the Measure, making it custom, see Working with Explores for more detail.
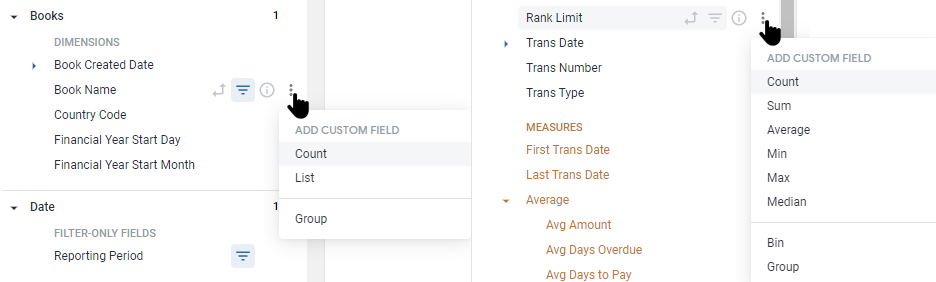
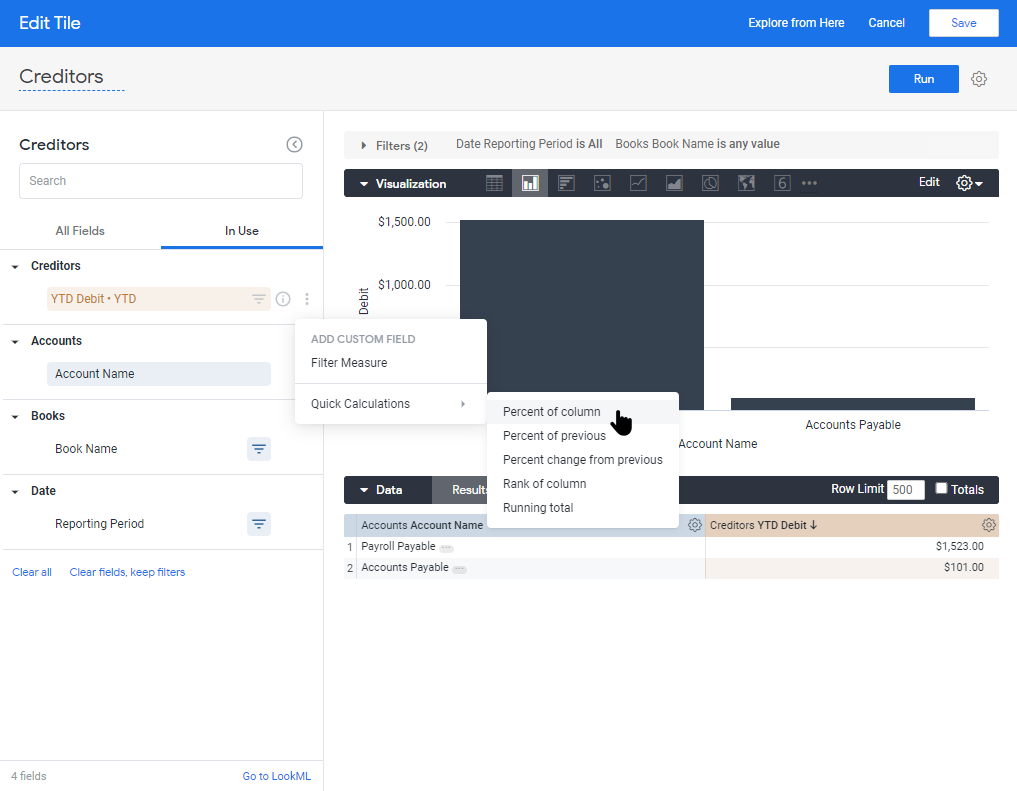
Beside the All Fields tab is the In Use tab, which shows only those fields that have been selected for the Tile. For Measures on this tab, the More ellipsis button also offers the option to add various calculated columns based on the Measure. The In Use tab also has links to Clear all from the Tile, or you can Clear fields, keep filters. For more detail see Working with Explores.
Select the fields you want on the dashboard, clicking run to preview the data as you build.
Once you have the Tile looking the way you wish, click Save to save the Tile, then Save again to save the Dashboard.
Text
You can also add tiles containing only text to the Dashboard, from the Add Tile menu.
The Add Text dialog opens for text to be entered. Both the title and the subtitle will be centred, while the body will be a block of text.
Configuring content
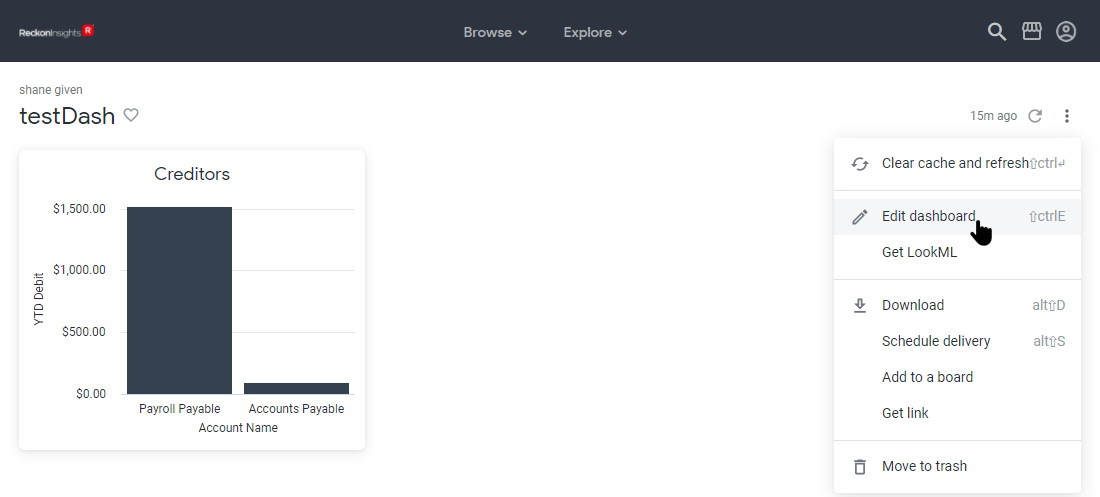
The newly created Dashboard can be edited by clicking the ellipsis menu at the top right and selecting Edit dashboard.
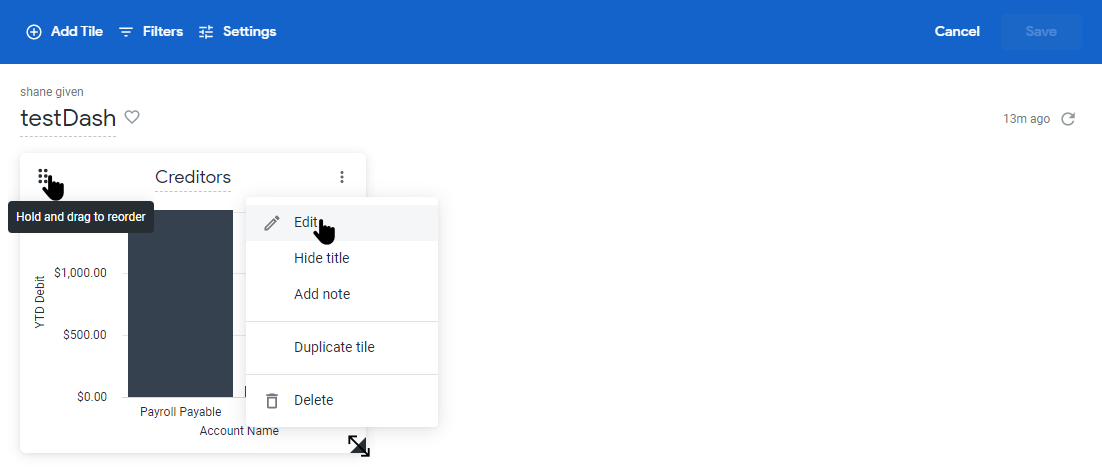
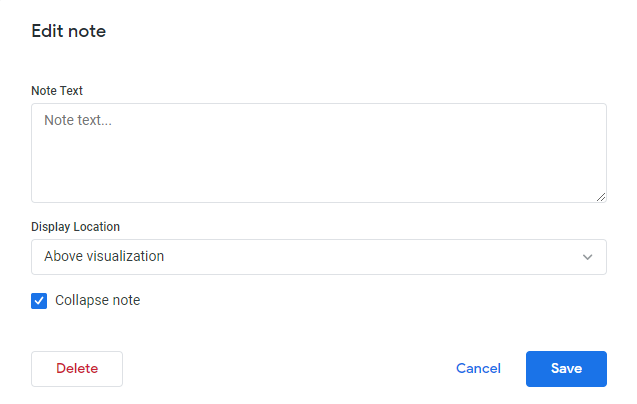
The Dashboard name can now be changed. The individual Tiles can also be moved with the grab-handle at the top-left of the tile, be edited, duplicated or deleted, have the title hidden or a note added via the ellipsis menu at the top-right, and be resized using the sizing handle at the bottom-right of the Tile.
When adding a note to a tile, it can be positioned above the visualisation (but below the title), below the visualisation, or as hovering text that is shown when the pointer hovers over the information sign (circled i) beside the title. When the note is not hovering text there is the option for the note to initially be collapsed, and expand when clicked.
Once changes have been made to the Dashboard, the Save control is enabled. Click this when finished editing the Dashboard, or Cancel out of making changes.
Adding filters
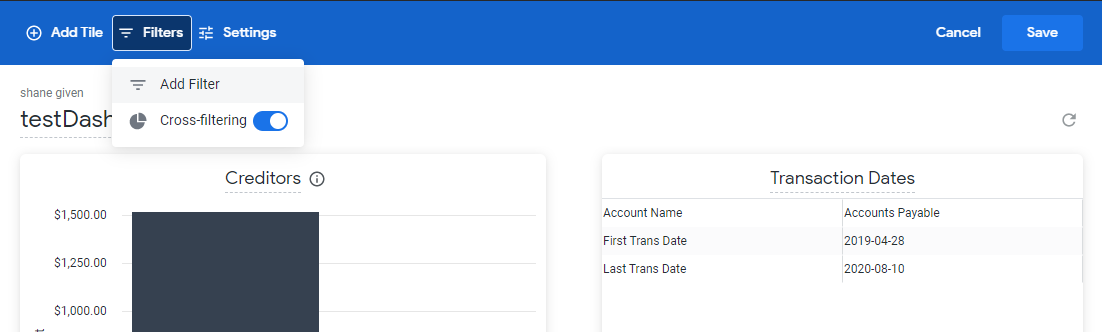
As well as adding filters to individual Tiles, Filters based on any of the fields in all of the Explores used on the Dashboards Tiles can be added to the whole Dashboard. Filters added in this way can apply to some or all of the Tiles on the Dashboard, and they override filters on individual Tiles based on the same field. Care needs to be taken as it might not be clear which Tiles the Dashboard Filters are affecting. Including the Tile filters in the data can make this more obvious. Click the Add Filters menu and select Add Filter.
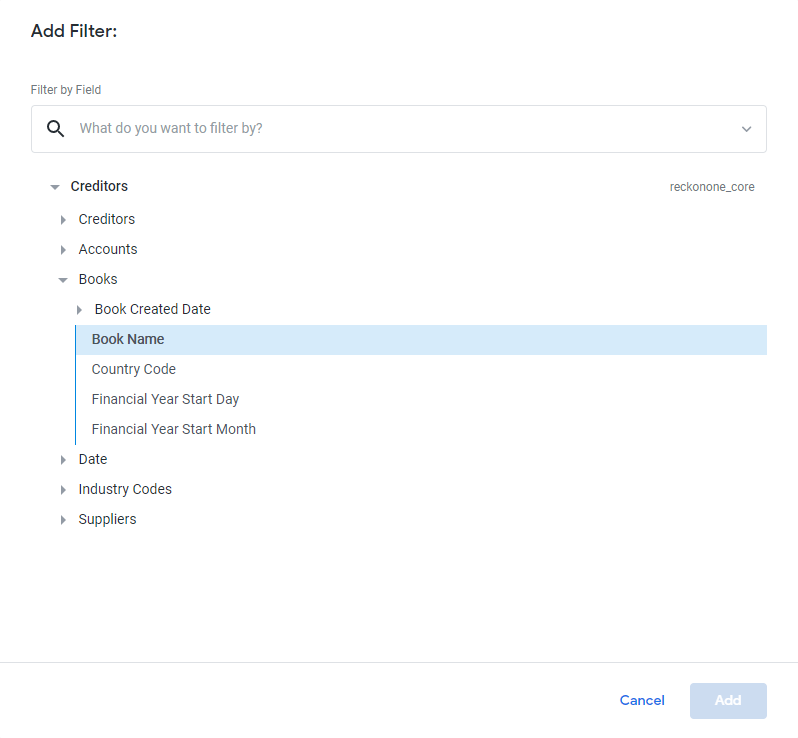
The Add Filter dialog opens from which you can select the field to filter by.
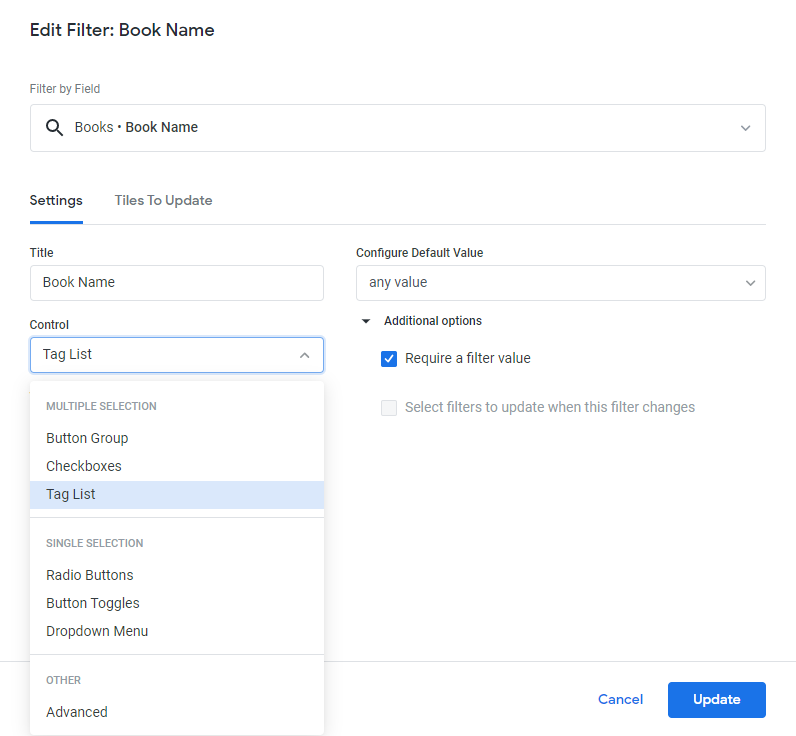
Once a field has been selected the dialog changes to show the Settings and Tiles to Update tabs.
From the Settings tab you can:
- Change the name of the Filter
- Add default value(s)
- Select the type of control the Filter will present
- Set the Filter to require a value
- Set this Filter to cascade-update other Filters (if present) when it is set.
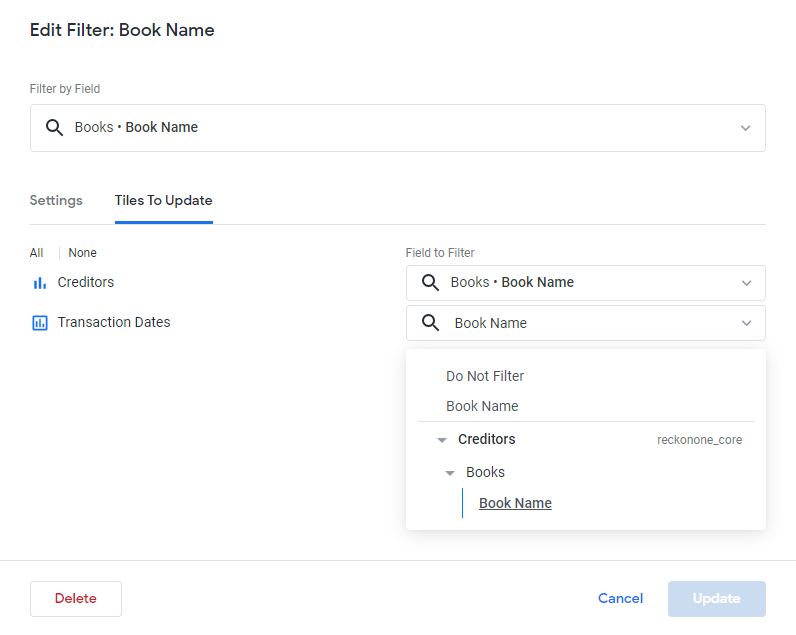
The Tiles To Update tab lets you select which of the Dashboard Tiles will be affected by the Filter. In general it is a good idea to have Filters apply to all Tiles.
Cross Filtering
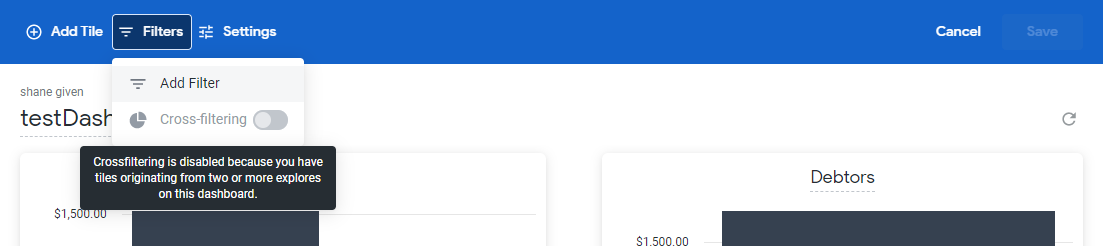
Cross Filtering can only be used when all Tiles on a Dashboard are from the same Explore, when there are more than one source Explore, the Cross Filtering button is disabled.
When all the Tiles on a Dashboard are using the same source Explore, Cross Filtering can be enabled, and connects all the Tiles together so that clicking on a data point on one Tile will Filter all the Tiles to the same value.
Altering settings
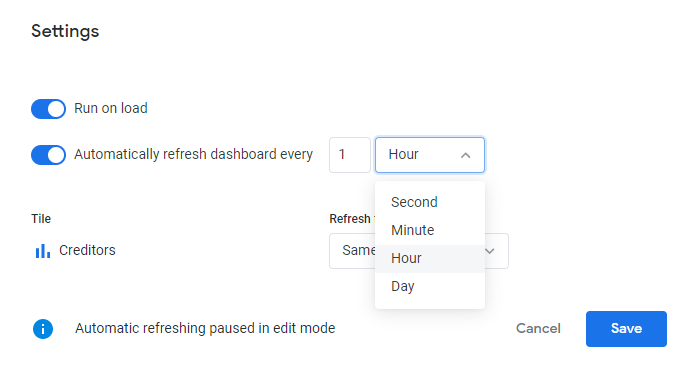
There are settings that apply to the entire Dashboard, rather than a Tile. The Dashboard can be set to run and display data when the Dashboard is opened. However, if there are filters on a Dashboard that have been set to require a value (such as Book Name) but without default values, this will prevent the running of that Dashboard until the filter has a value.
The Dashboard can also be set to automatically refresh itself at specific time intervals ranging from seconds to days. However, the refresh rate of the source data itself varies from every 2 hours, to overnight (depending on the source), so refreshing more often than this is unnecessary.
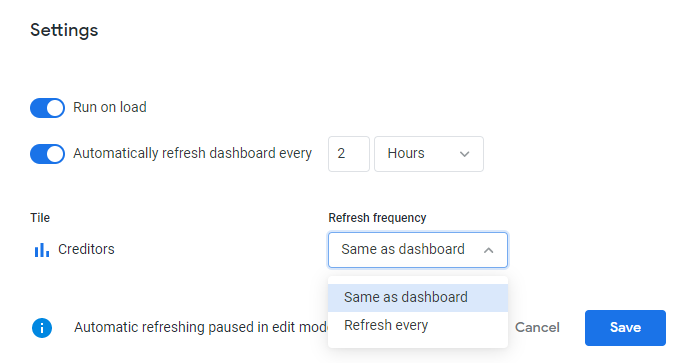
Individual Tiles on the Dashboard can either refresh when the Dashboard does, or have their own refresh schedules, with the same range of options as available to the whole Dashboard.
Sharing a Dashboard
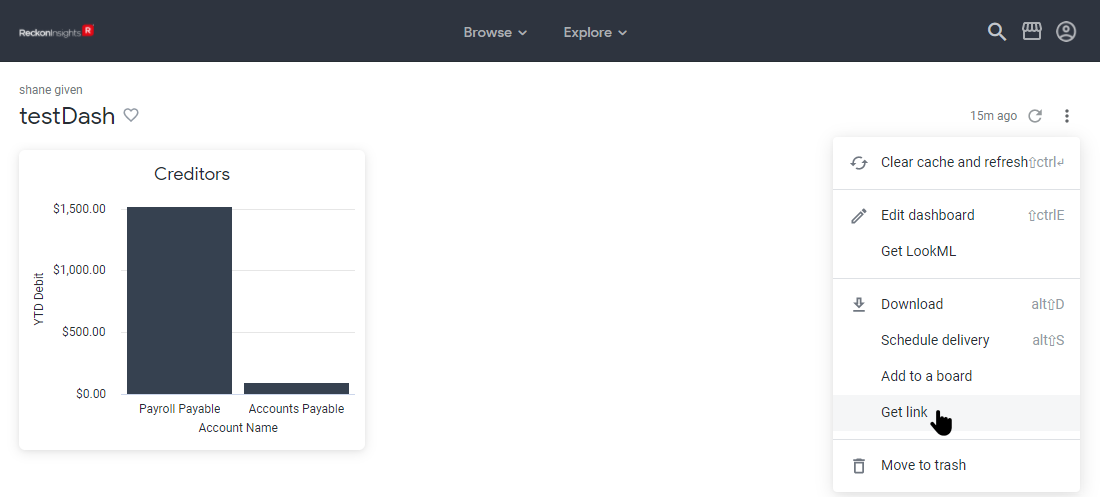
To share a Dashboard, click the ellipsis menu at the top-right, and select Get link.
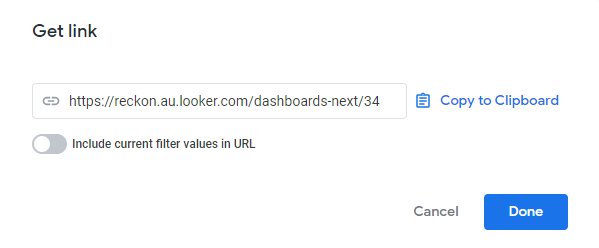
Then click Copy to Clipboard. The toggle Include current filter values in URL is on by default. Toggle it to off if this is not the desired result. Click Done.
You can now send the Dashboard URL to the intended recipient via an appropriate communication tool.
Back to Table of Contents - Creator
Need more help?
Ask the Reckon Community at: https://community.reckon.com/
Or
Log a Support Ticket: https://www.reckon.com/au/support/