Table of Contents
Working with Explores - Continued - Reckon Insights Creator
Working with Explores - Continued
More detail on working with Explores
This article continues on from Working With Explores.
Copying column values
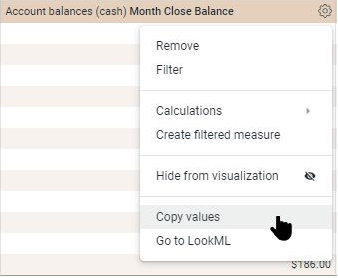
To copy all the data from a table column, click on the column's gear menu and select Copy Values
Removing fields
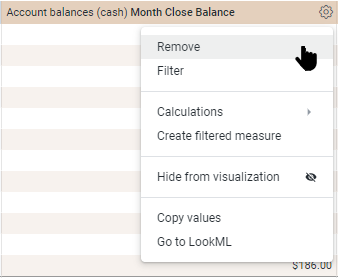
Remove a field from an Explore by clicking the field’s name in the Field-picker, or by clicking on the column's gear menu and selecting Remove.
Reordering columns
Click on a column header and drag to reorder the column.
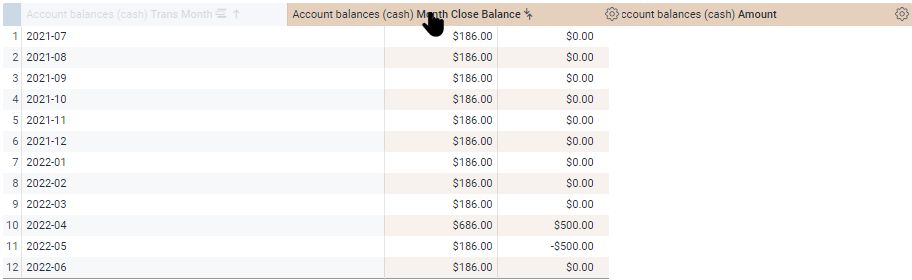
Columns under a pivoted dimension can be reordered, but the order of pivoted dimensions must be changed by changing the sort order.
When there is a pivot, the Row Totals can switch position by toggling the chevron between < and > .
Field-picker icons
The icons next to each field in the Field-picker are:
Pivot
Click to pivot or unpivot a field in an Explore. This icon will appear bold when a field is pivoted. This icon was discussed in Working with Explores - Adding a Pivot.
Filter
Click to add or remove a field as an Explore filter. This icon will appear bold when it is an active filter. This icon was discussed in Working with Explores - Adding Filters.
Info
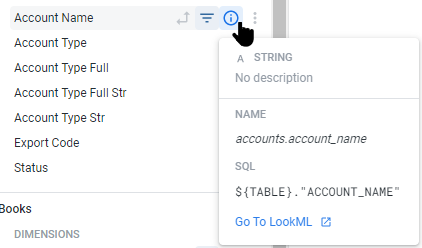
Click to have some details about a field displayed.
More
Click the More icon ( ⋮ ) to quickly and easily create Custom Fields (discussed below), or for Custom Fields, edit, duplicate or delete the Custom Field.
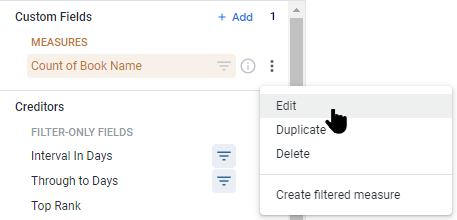
Field-picker Custom Fields
Custom Fields can be created from both Measures and Dimensions.
Measures can only be used to create a Filtered Measure, while Dimensions can be used to create Bins, Groups, and Aggregated fields.
Bins are used to separate the values of a selected numeric dimension into a custom set of number ranges, while Groups are used to bucket results of a selected dimension under custom labels.
The Aggregates are:
- Count distinct: Counts the number of distinct values for a selected dimension
- Sum: Adds the values of the selected Dimension
- Average: Averages the values of the selected Dimension
- Min: Finds the minimum value of the selected Dimension
- Max: Finds the maximum value of the selected Dimension
- Median: Finds the midpoint of the selected Dimension
- List of unique values: Creates a list of distinct values of the selected Dimension
Adding Custom Fields
The easiest way to create Custom Fields is using the More ( ⋮ ) icon in the Field-picker to Bin or Group the Dimension, or select the appropriate Aggregate.
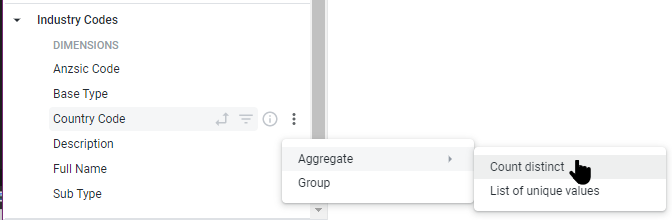
In the example above, selecting the distinct count of Country Code will create a new custom field giving the count of the number of countries represented in the data, as seen below.
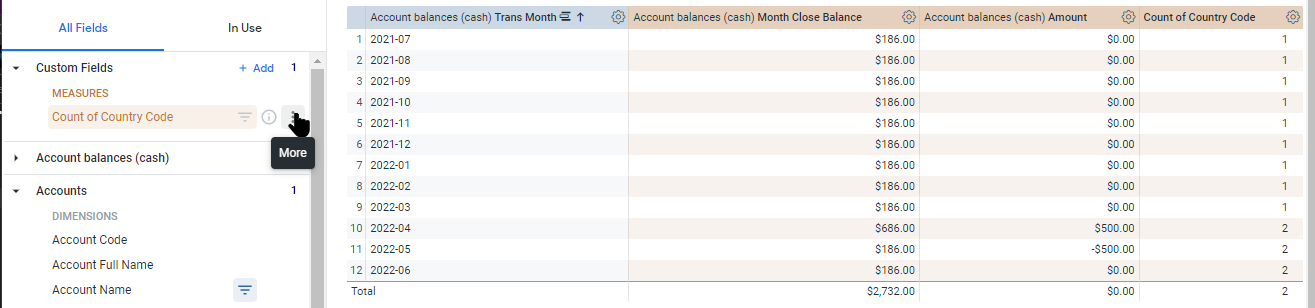
Editing Custom Fields
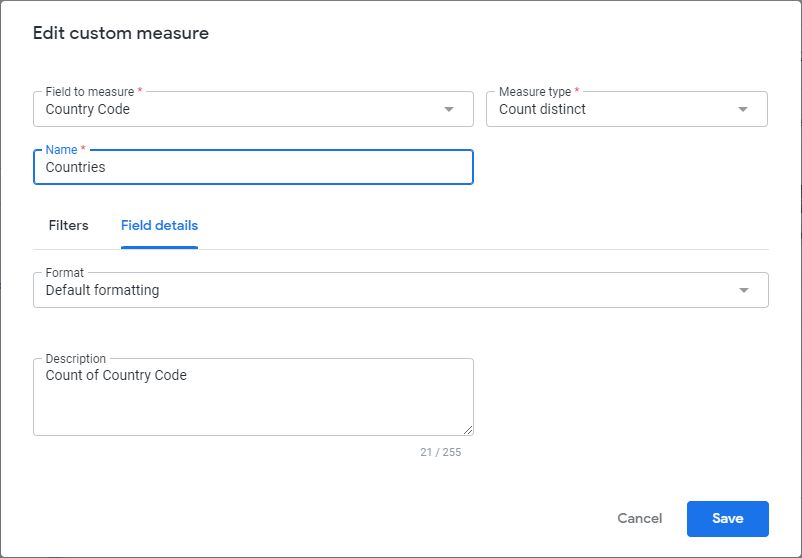
Click the More icon ( ⋮ ) of the Custom Field to be edited, and select Edit, this opens the edit dialog. Filters can be added to the Custom Field from the Filters tab.
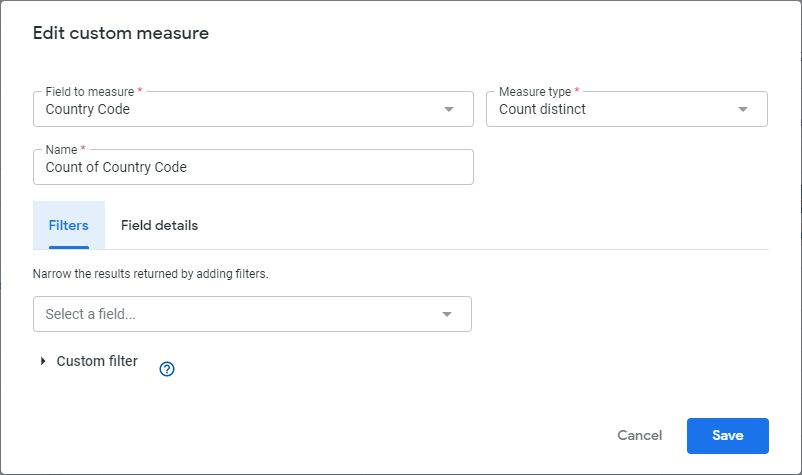
Make the changes required and click Save. Here, the name has been changed, then the Field details tab has been selected, and a description added. It is best practice to add a description.
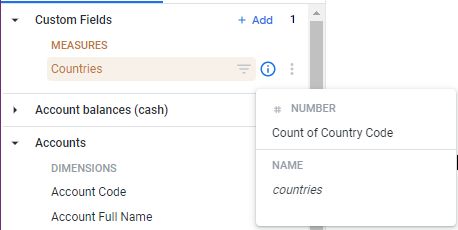
The Custom Field has been updated.
Duplicating Custom Fields
Click the More icon ( ⋮ ) of the Custom Field to be duplicated, and select Duplicate.
Duplicating and then editing a Custom Field can be useful to create multiple Custom Fields with minor differences, e.g.: 30-day, 60-day, 90-day sums.
Deleting Custom Fields
Click the More icon ( ⋮ ) of the Custom Field to be deleted, and select Delete.
Visualisation types
The Visualisation type selected determines how the data series is displayed. There is plentiful information available online regarding chart selection, so a very quick guide is:
To compare values:
- Column
- Bar
- Line
- Scatterplot
To show proportion:
- Pie
- Stacked Bar
- Area
- Waterfall
To understand range and distribution:
- Scatter Plot
- Line
- Column
- Bar
To analyze trends:
- Line
- Dual-axis Line
- Column
To look for relationships:
- Scatterplot
- Line
The Visualisation types available in Reckon Insights are:
Charts
Column
Bar
Scatterplot
Line
Area
Pie
Donut Multiples
Funnel
Timeline
Waterfall
Text and Tables
Single Value
Single Record
Table
Table (Legacy)
Table Report
Table with subtotals
Wordcloud
Maps
Map
Static Map (Points)
Static Map (Regions)
Other Charts
Box Plot
Liquid Fill Gauge
Back to Table of Contents - Creator