Drill-through options - Reckon Insights Creator
Drill-through options
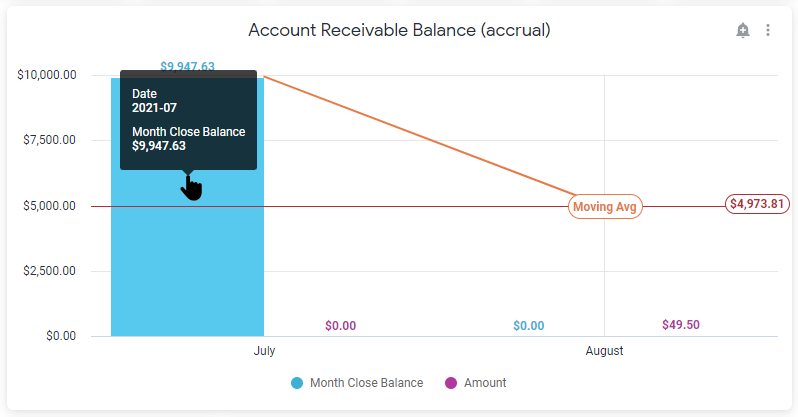
Insights visualisations are great for presenting and working with your data, but it’s always useful to understand what makes up the figures of KPIs. All Insights visualisations have some form of mouse-over hover tooltip giving you additional information.
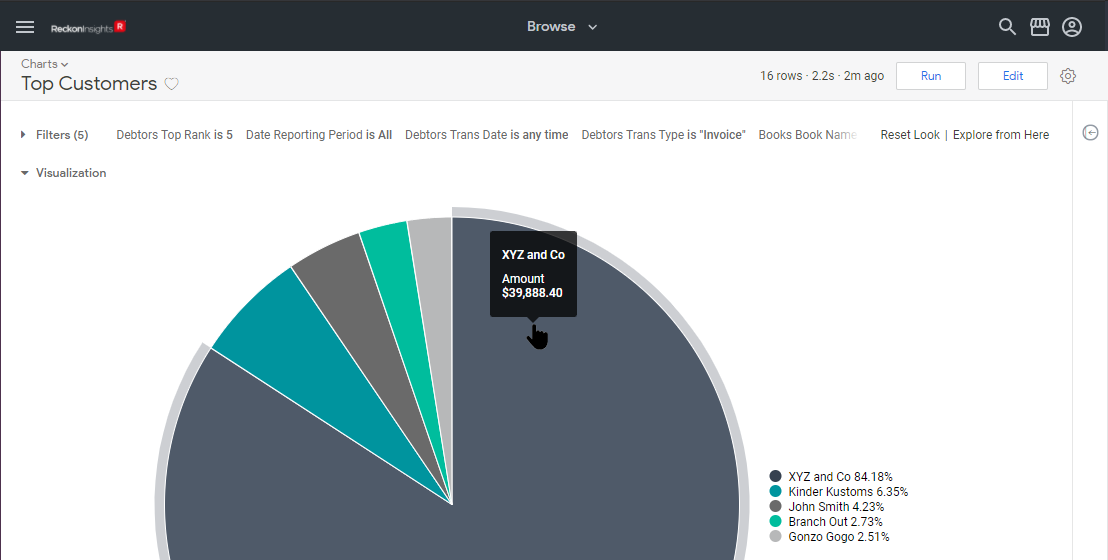
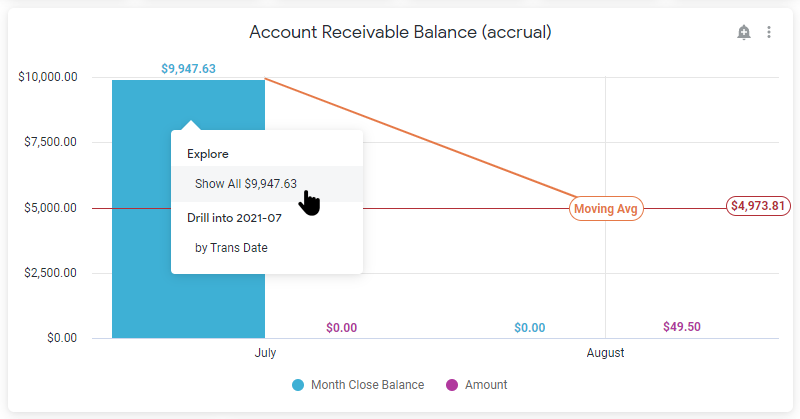
If you have a Creator licence, there are also context-menus allowing you to drill-through into the data. Click to display the context-menu.
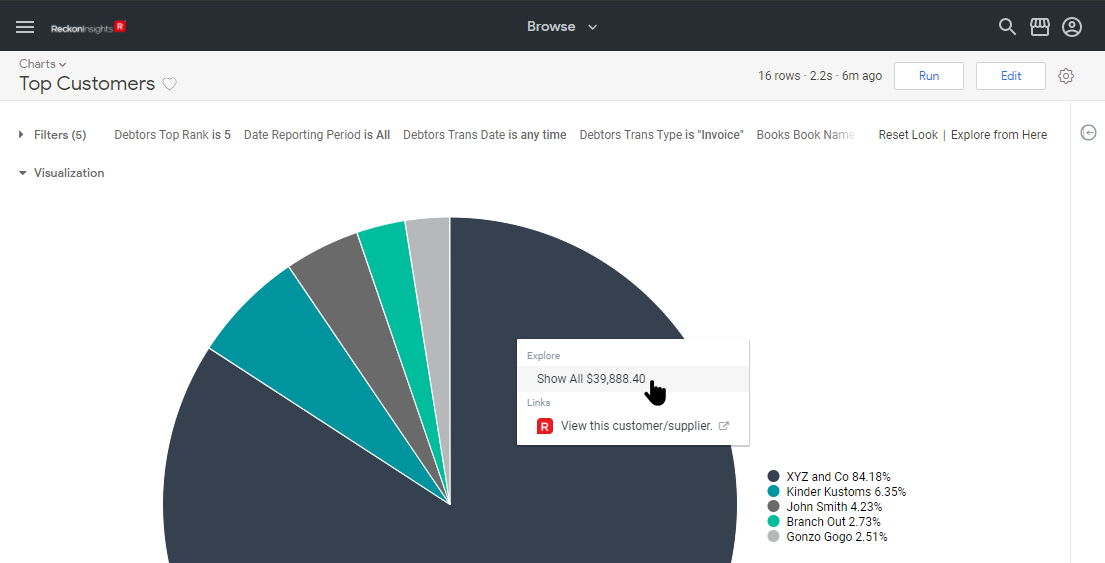
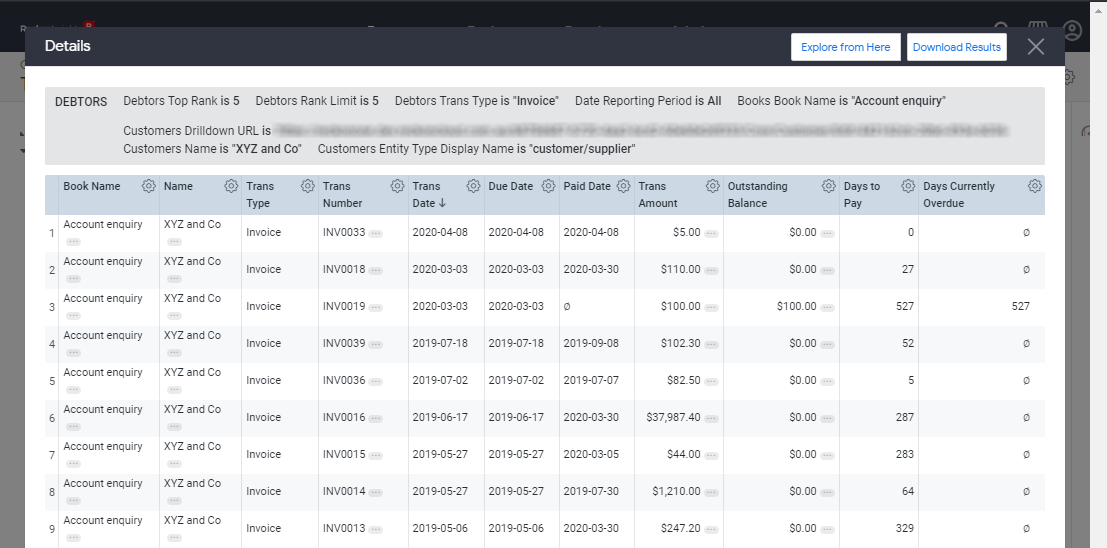
Click the Show All... entry to drill-through to the transactions that make up a figure, and from there, explore the data, or download it for further analysis.
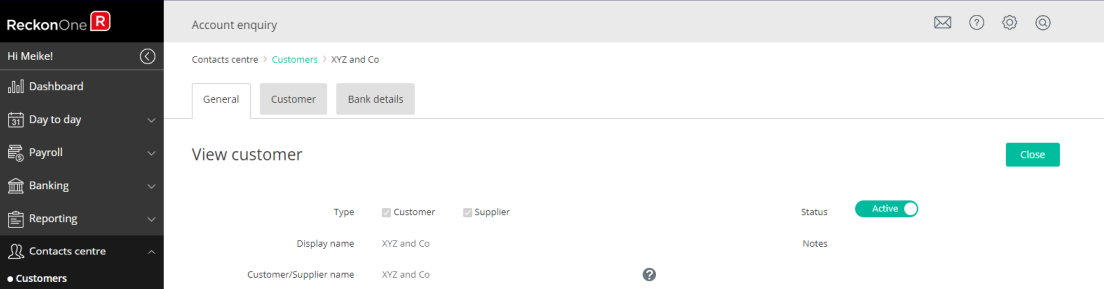
Dashboards can have a variety of drill-through options, as they can contain different types of visualisations. Always move the mouse over all the different items available to see what functionality has been built-in to view or access additional information. Use the link to the parent folder (above the title) to move back to the parent folder.
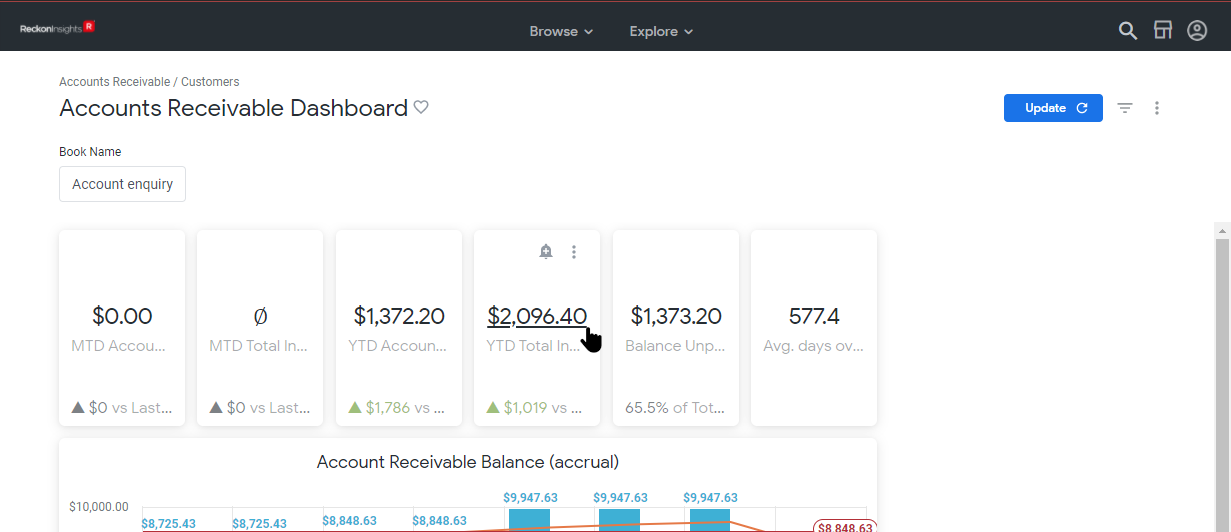
Most individual KPIs link through to underlying detail.
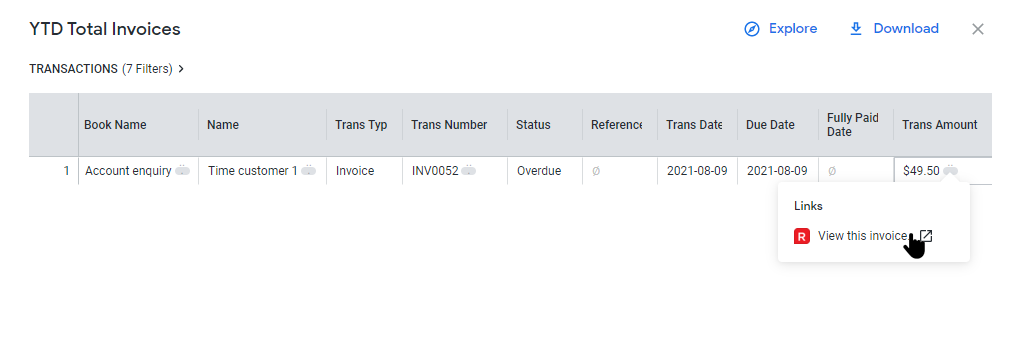
And from there to the actual transactions.
Charts also have their tooltips and drill-through context-menus.
Tooltips and drill-throughs are some of the fundamental ways to get more out of your Insights experience, so be sure to browse around, to see what can found.
Back to Table of Contents
Need more help?
Ask the Reckon Community at: https://community.reckon.com/
Or Log a Support Ticket: https://www.reckon.com/au/support/