Table of Contents
Getting Started with Reckon Insights – Explore Mode
About
When you first start with Reckon Insights, after completing the setup and configuration, you might ask yourself:
What’s next?
A new visualisation tool can feel overwhelming at first. That’s why, when you log in, the Home page displays pre-built templates, grouped by common use cases, to help you get started quickly.
But what if:
- You don’t have time to explore all the features?
- The available templates don’t quite meet your needs?
In that case, the key to creating meaningful content is to start by answering three essential questions:
- What do I need to show, and how much detail is necessary?
- Who’s going to be looking at this — like my accountant, a manager, or the sales team?
- What kind of decision should this help them make?
Key considerations
Creating impactful content requires more than just selecting data. It helps to have some subject matter knowledge and a clear purpose. Here are some best practices to guide you:
- Understand your audience: Choose the right dataset that answers your audience's questions and is relevant to their needs.
- Choose the right visualisation type: Different insights require different visual formats. Use appropriate visualisations to effectively communicate your data.
- Use tables for detailed records
- Bar or line charts for comparisons and trends
- Pie charts for showing parts of a whole
- KPIs for quick highlights
- Simplify and Clarify: Keep visualisations simple and avoid clutter to ensure clarity.
- Consistency: Use consistent colours, fonts, and styles across all visualisations for a cohesive look.
- Accuracy and Integrity: Ensure all data used in visualisations is accurate and up-to-date.
Reckon Insights isn’t just about displaying numbers—it’s about transforming data into clear, actionable insights. Whether you're tracking cash flow, monitoring debtors, or analysing P&L trends, a structured and thoughtful approach ensures your visualisations are useful and impactful.
Creating Content in Reckon Insights
Reckon Insights allows you to create content using various formats like Charts, KPIs, Ratios, and Reports. While they appear different, the process of creating them is largely the same—they just use different visualisation styles.
A Measure is a calculated value—it tells you how much or how many.
Choose your Explore model source
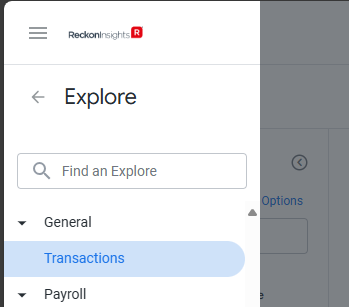
- In Reckon Insights, click the Main Menu (top-left corner).
- Select Explore, then choose the Transactions model.
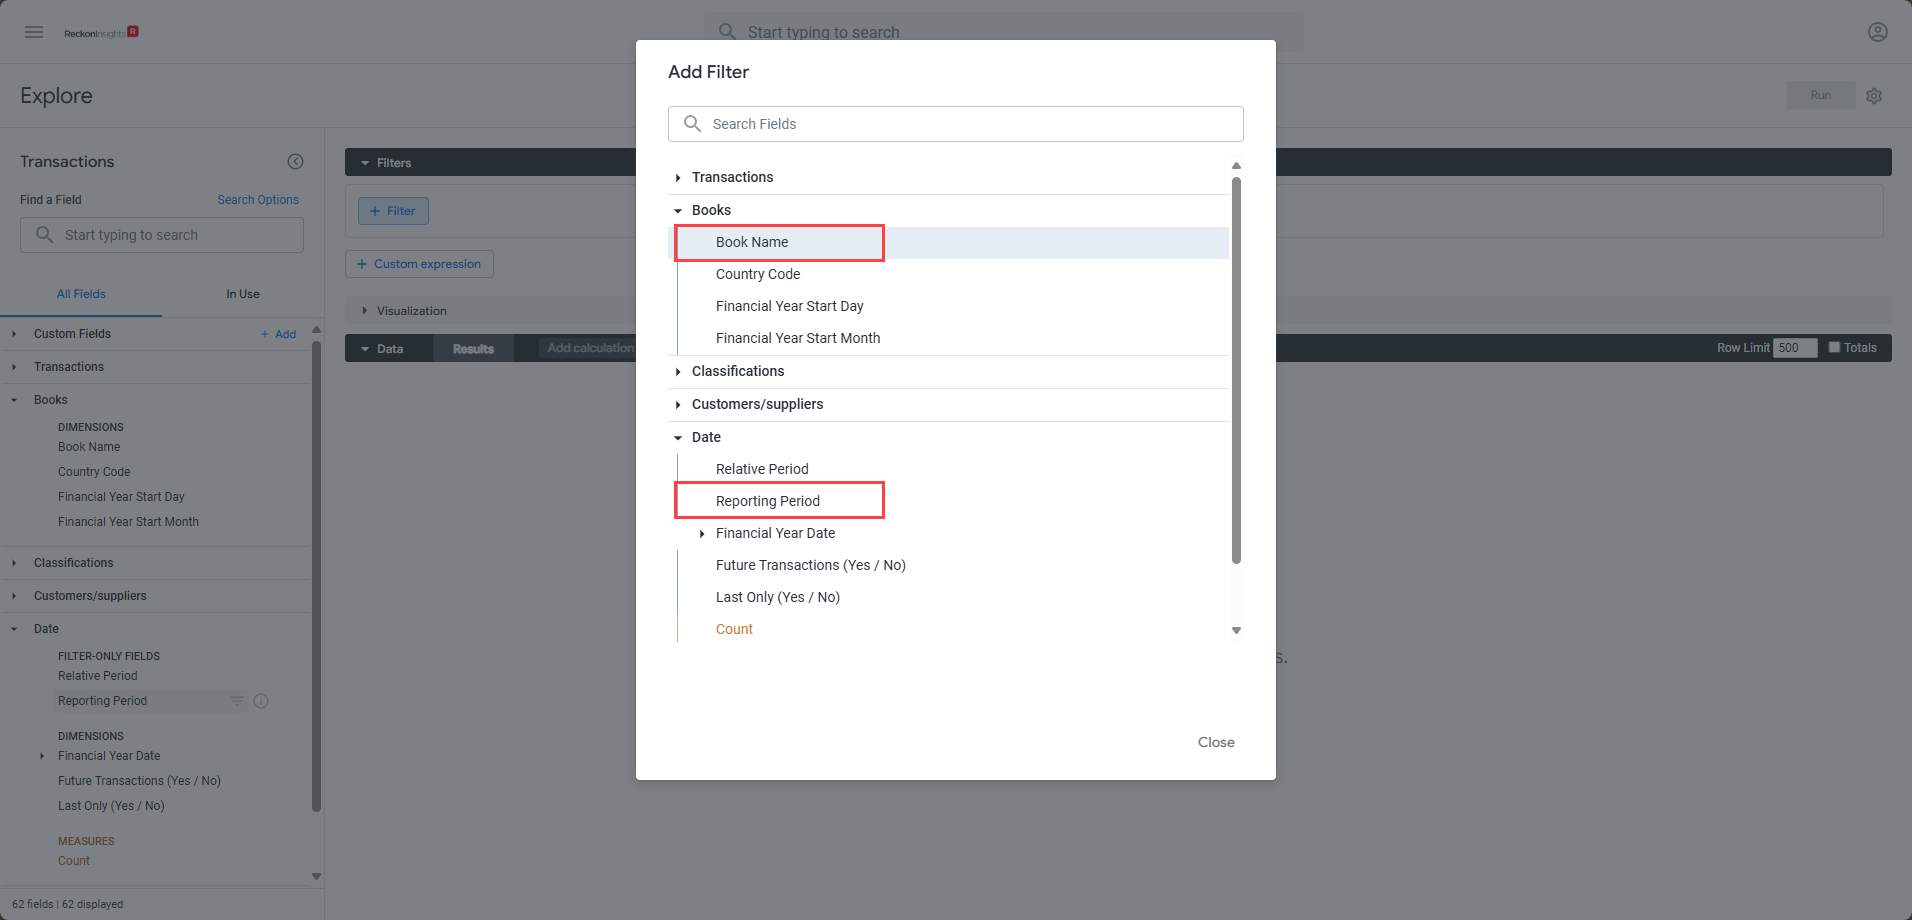
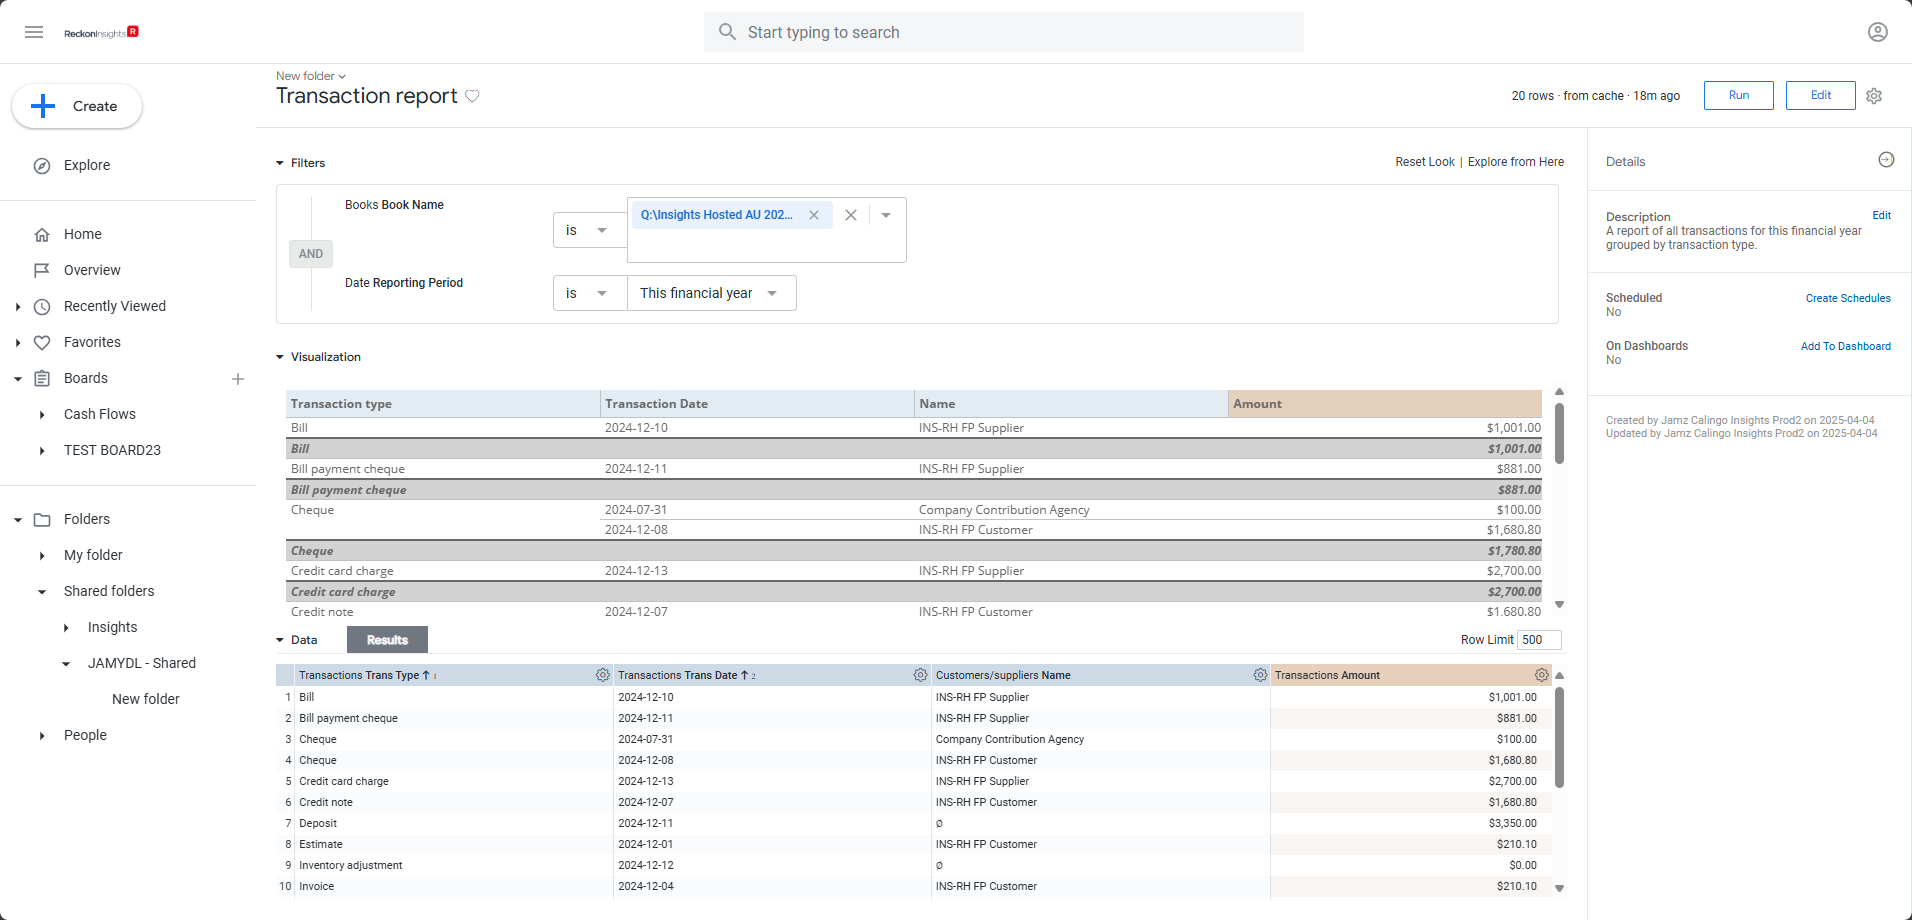
Filter the data
Apply filters to narrow your data. For example:
Field | Dimension/Measures | Value (Example) |
Books | Book Name |
|
Date | Reporting Period | This financial year |
Select the Data fields you need
- Add the following Data fields in this order:
Requirements | Field | Dimension/Measures |
Transaction Date | Transactions | Trans Date > Date |
Transaction Type | Transactions | Trans Type |
Name | Customers/Suppliers | Name |
Amount | Transactions | Movement > Amount |
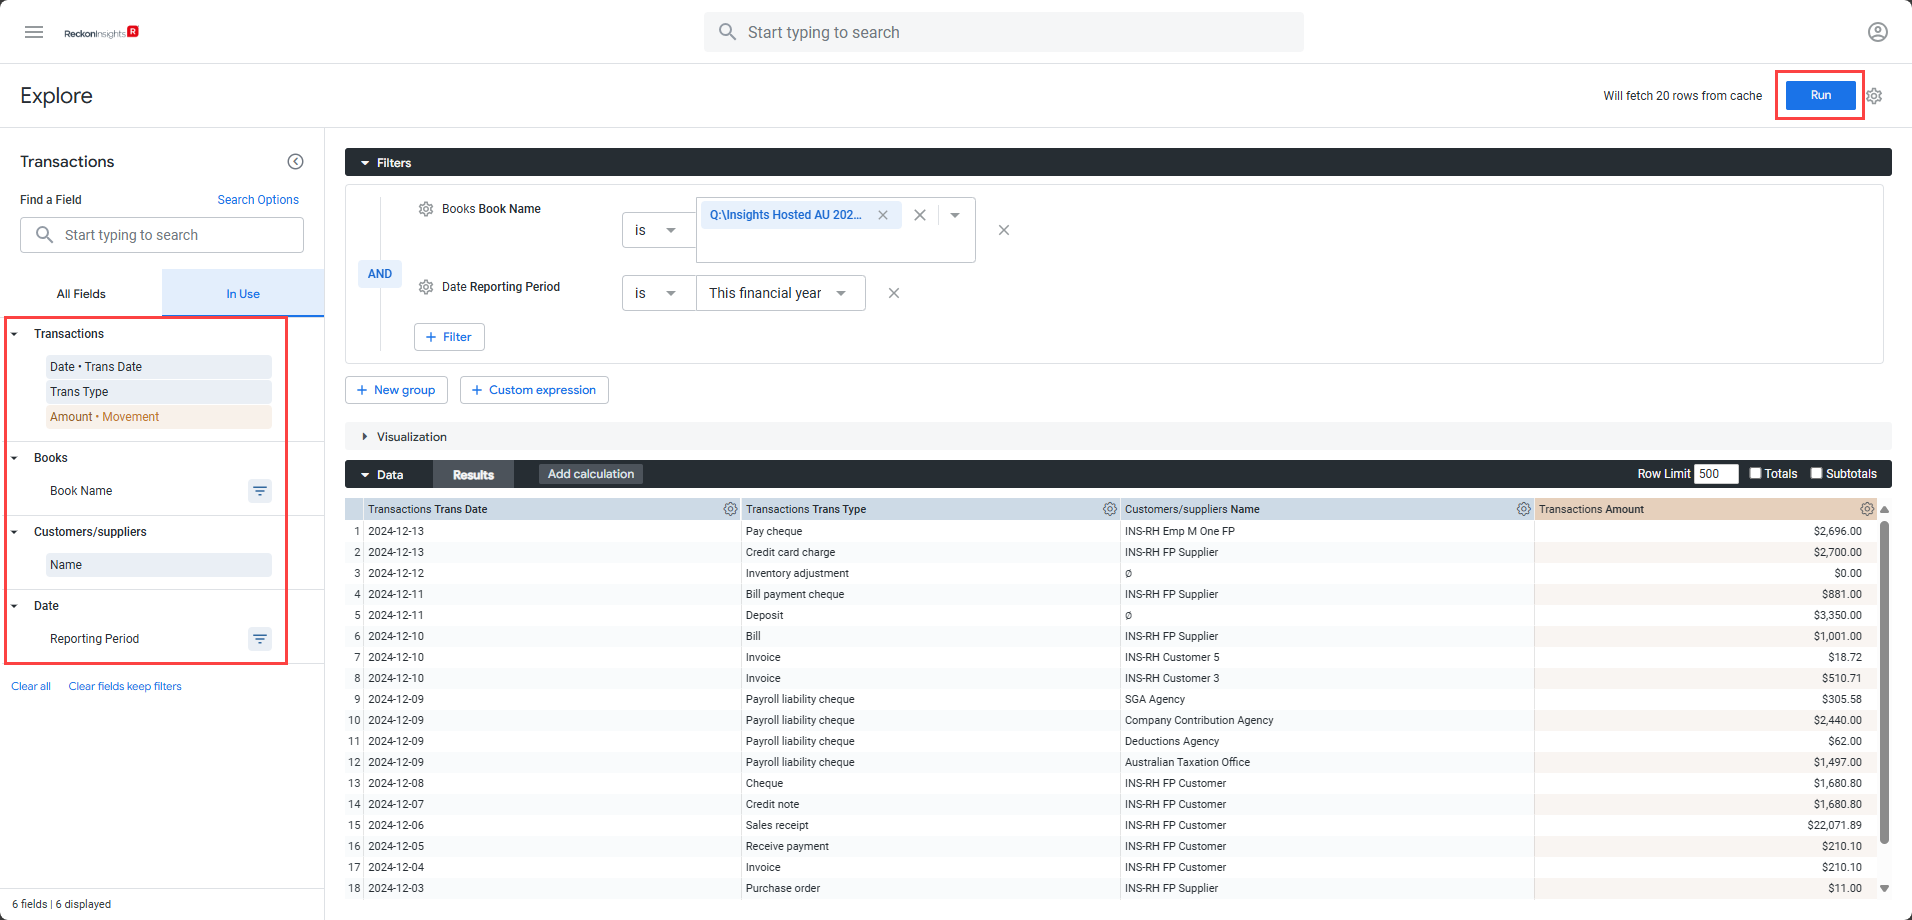
- Click Run (top-right) to view your data.
- In the Data section, drag the Trans Type to be the first column in order to group by transaction type.
- Click on Trans Type header to sort alphabetically. You may click
Shift + Clickto sort additional columns.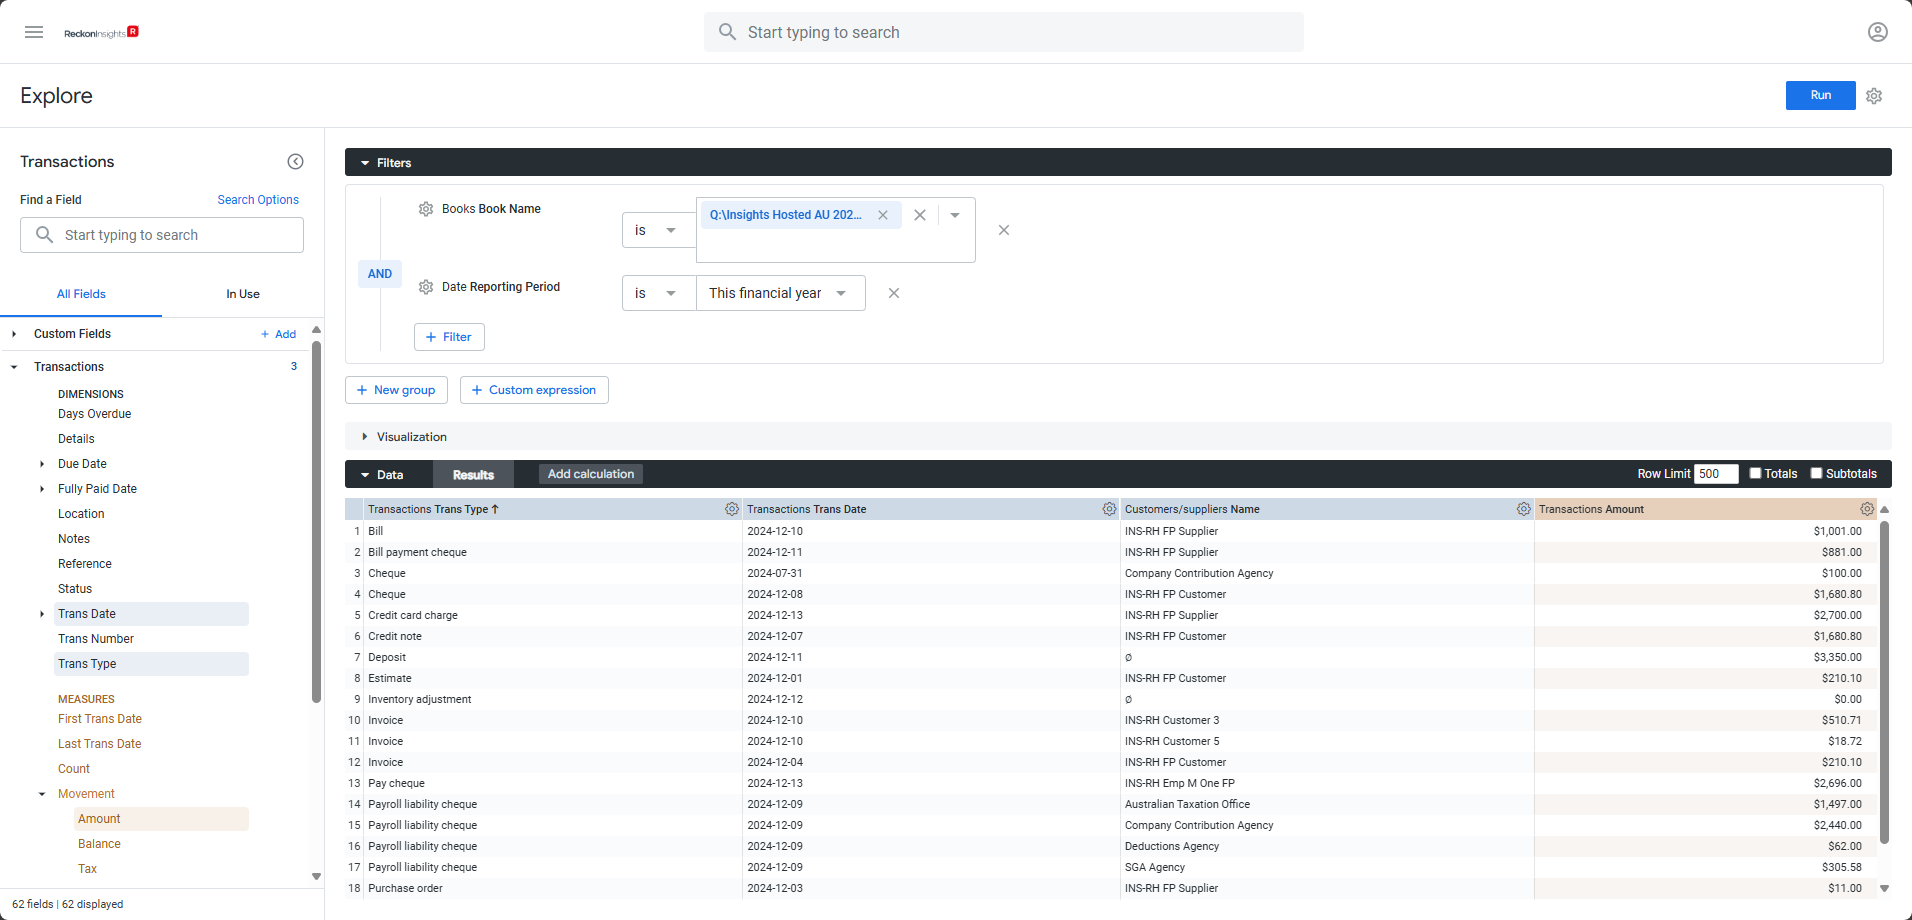
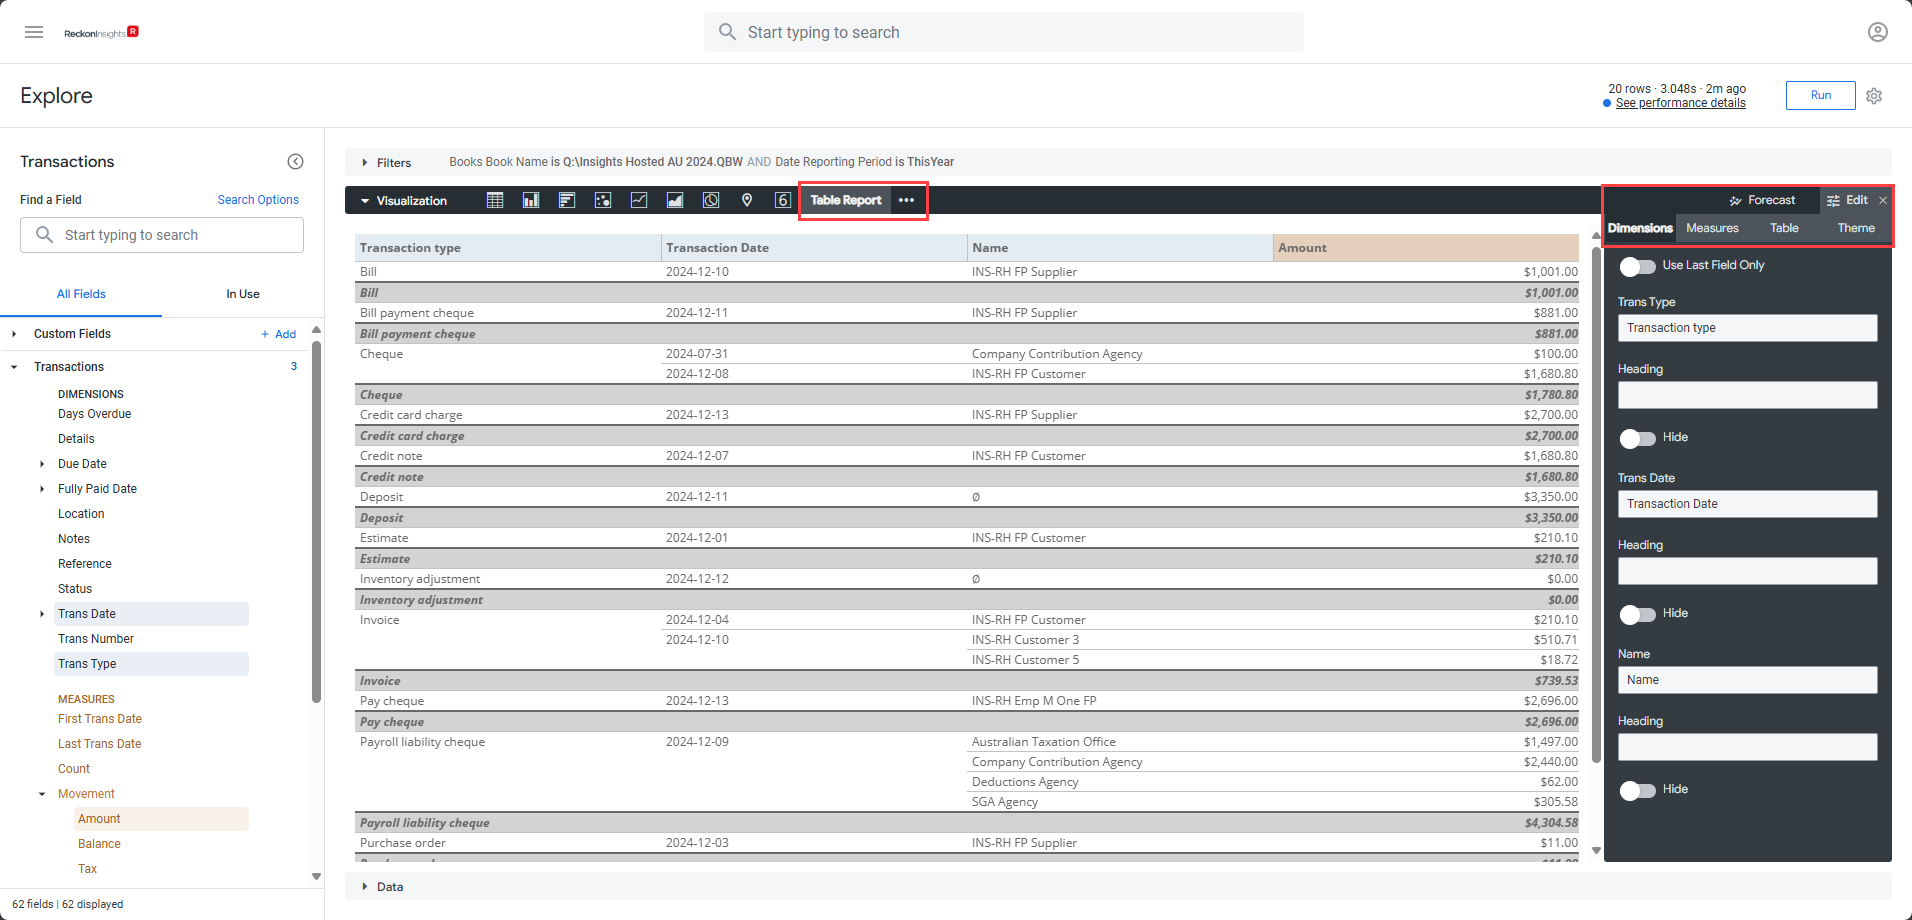
Choose how to display it
- Expand the Visualization section.
- Click the ••• (options menu) and select Table Report.
- Click Edit (far-right) and modify your visualisation:
Settings | Changes |
Theme | Set to Looker |
Merge Dims (Dimensions) | Enabled |
Row Subtotals | Enabled |
Dimensions headings | Rename the headings |
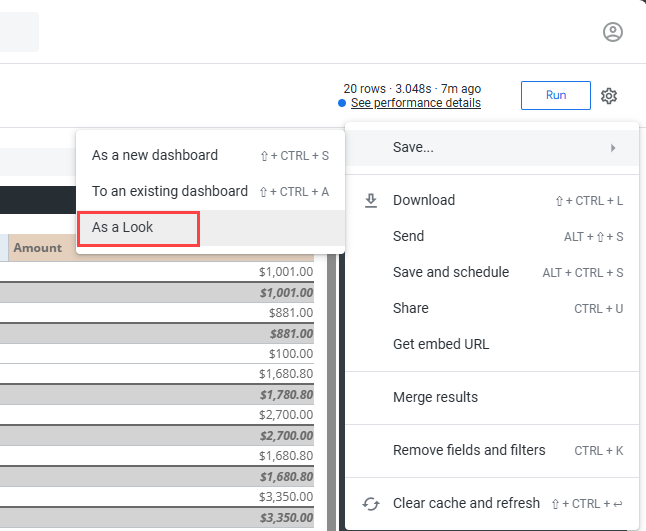
Save your content
A Look is a saved content or query that you can reuse or share anytime.
- Click on the Explore actions (Settings) gear icon on the top-right.
- Select Save > As a Look
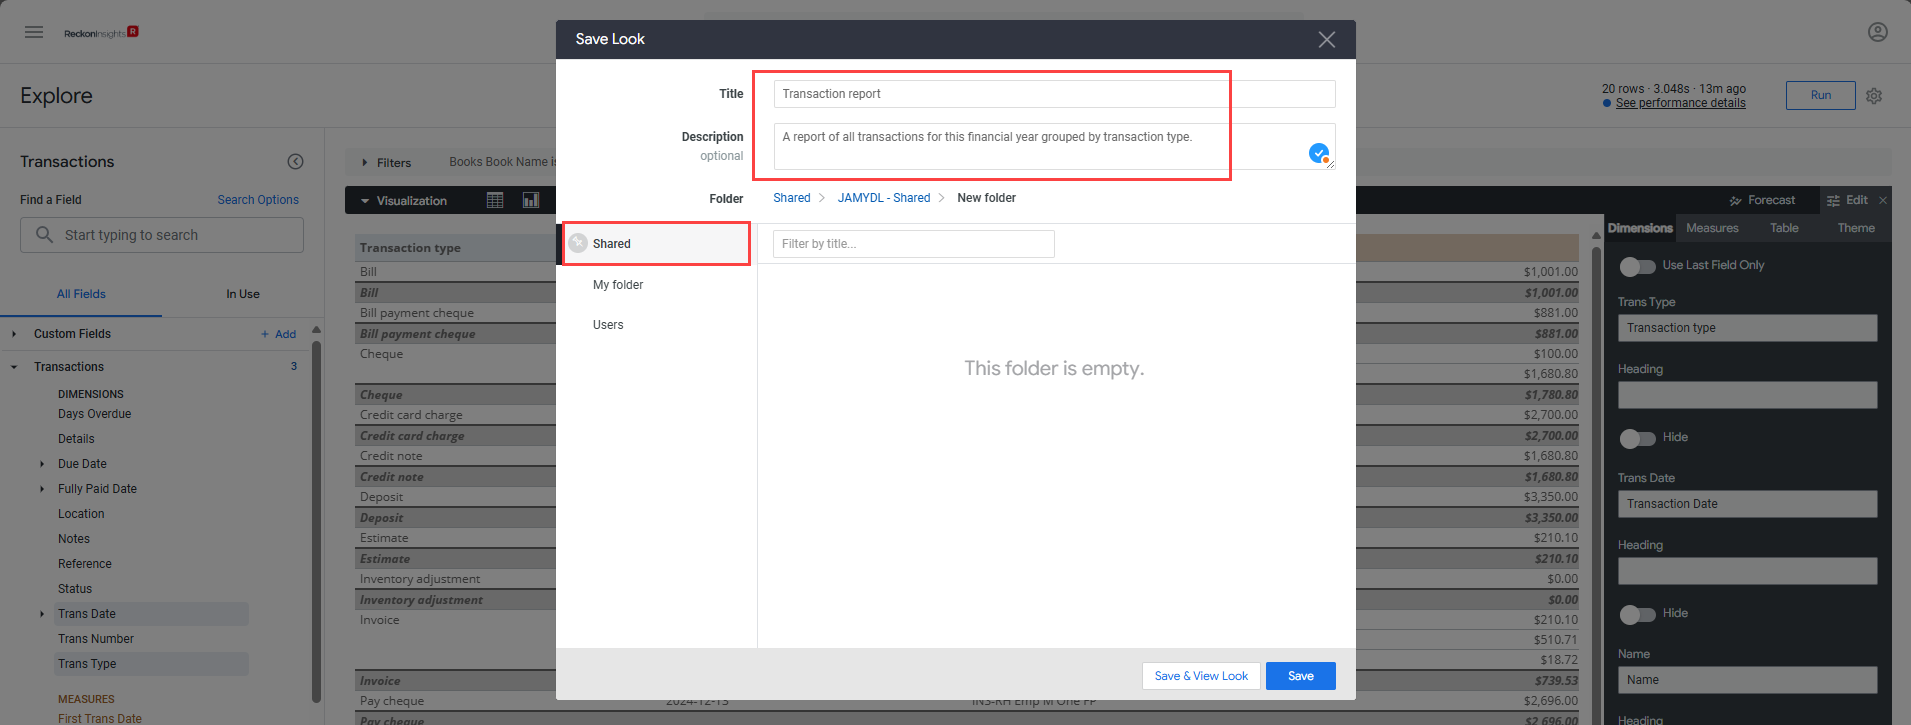
- Choose the Shared folder
- Add a Title and optional Description.
- Click Save.
- A direct link to your newly saved report will be available and can accessed anytime from the Shared folder.
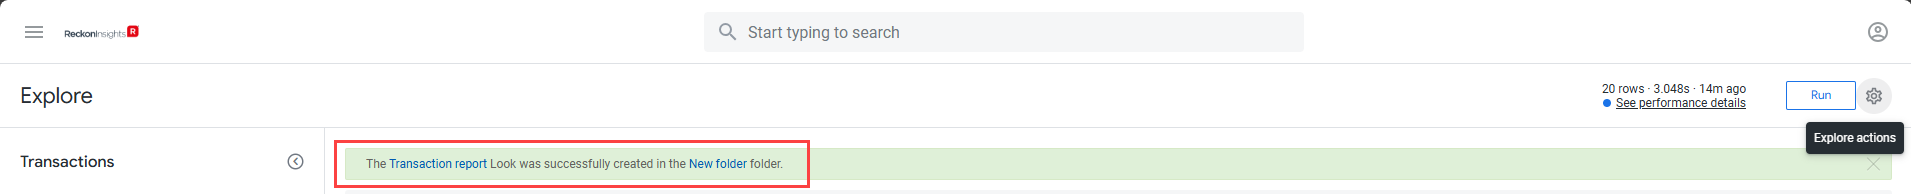
- When selected, it will redirect you to the content you created that is opened from the Shared folder location.
Next Steps
A Look is a saved content or query within Reckon Insights. It is highly recommended that these are always saved in the Shared folder.
How are Look Used?
Think of a Look as a custom report you build once and reuse anytime. You can:
- 📊 View live data that updates automatically.
- 📝 Download it as Excel, PDF, or many other formats.
- 🔁 Schedule it to be automatically emailed regularly.
- 🔗 Add it to a Dashboard to create a bigger picture.
- 🔍 Drill into it to explore more detail behind the numbers.
Now that you’ve learned how to create a content, start experimenting with different data sets and visualisation to uncover deeper insights.