Table of Contents
Find and access reports in Reckon One
Learn how to get to find, filter and run reports in Reckon One, as well as how to mark reports as favourites for easy access.
Go to the reports screen
To access your reports in Reckon One:
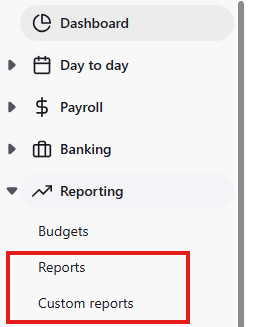
- In the Reporting menu, select Reports.
- On the reports screen, you’ll see two tabs:
- All: Shows every available report, grouped by type.
- Custom: Contains reports you’ve saved as custom. This tab can also be directly accessed by clicking on Custom reports in the Reporting menu.
Browse, filter and search for reports
Reports are displayed in groups. Click the chevron (arrow) next to a group name to display or hide the reports within the group.
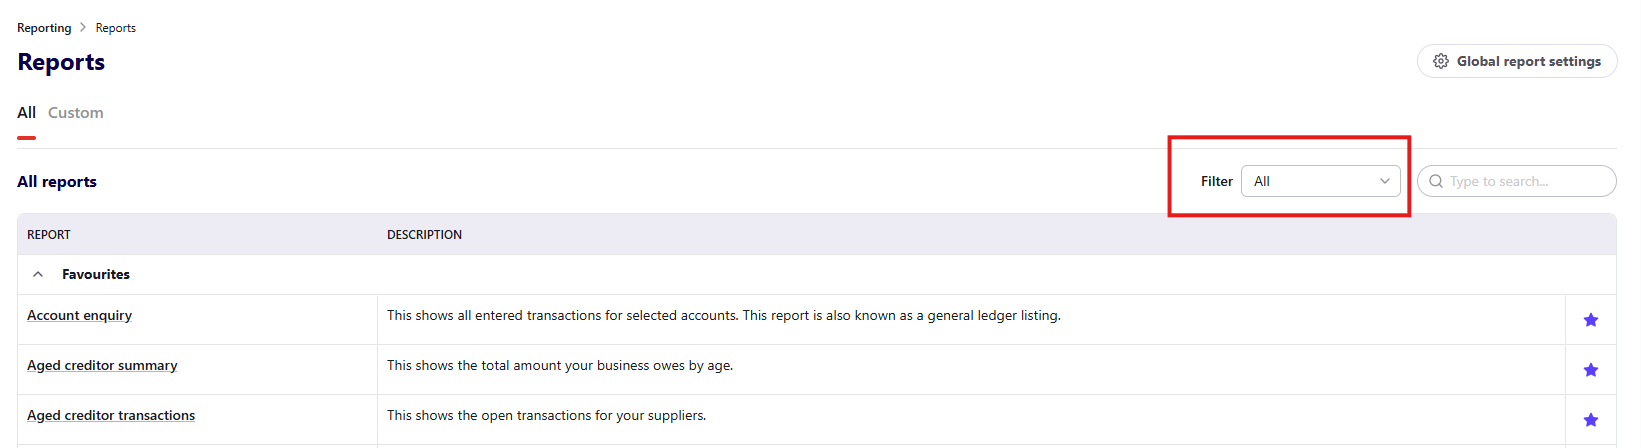
To filter reports by group
Use the Filter dropdown to select a report group. This narrows the list of reports to only reports in that group. You can filter report by one or many groups.
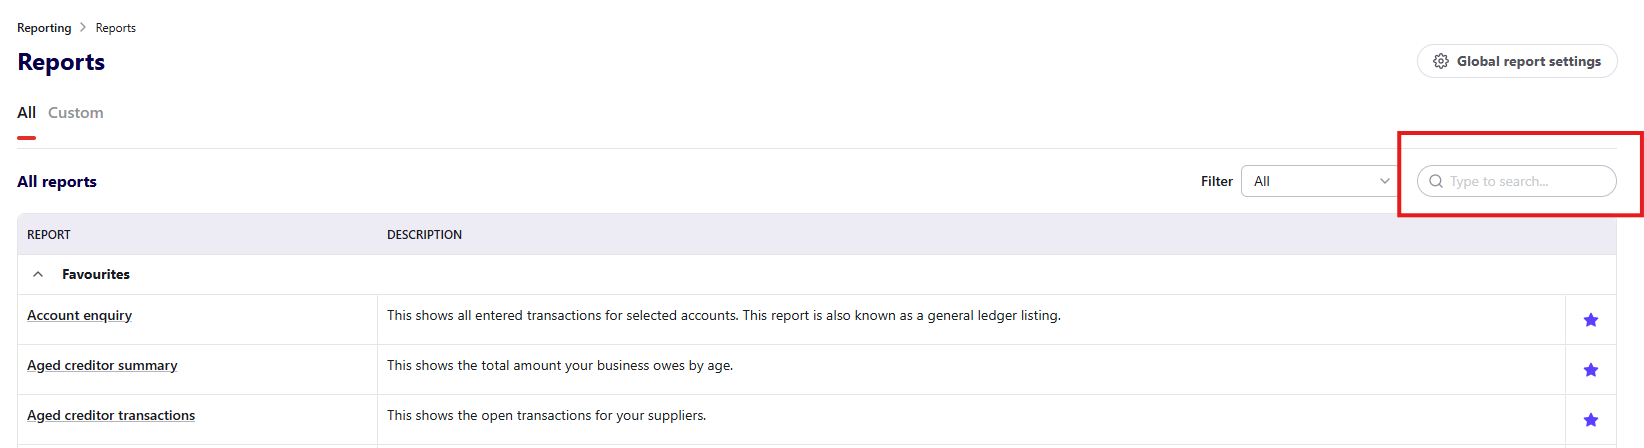
To search for a report
Use the search bar on the reports screen to search for reports by name or description. If you’ve filtered by report group, your search will only look for reports within that group. If you want to search across all groups, make sure no filter is applied.
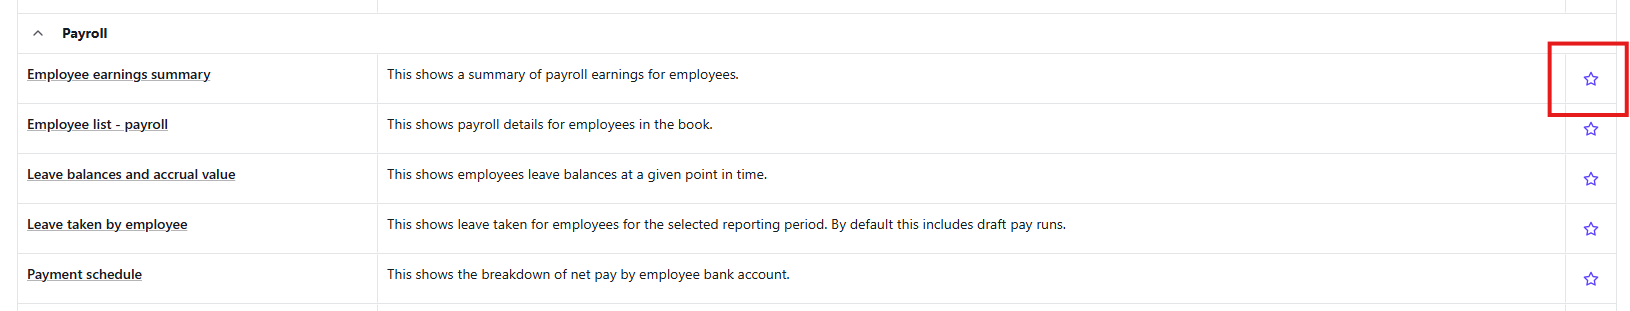
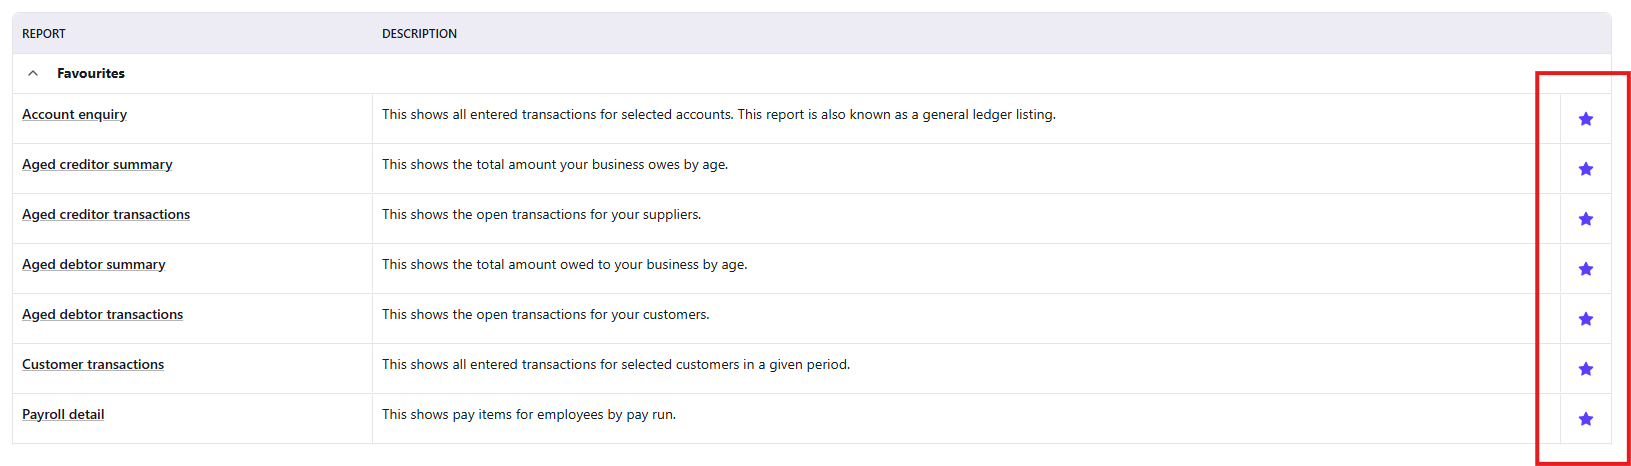
Mark a report as a favourite
To mark a report as a favourite, click the star icon next to the report. This will pin the report to the top of the All tab on the Reports screen, and create a link to the report in the side navigation of Reckon One, making it quicker to access.
Run a report
To run a report:
- In the Reporting menu, select Reports, then click on the report to open it.
- Adjust the Reporting period (the time range you wish to see data for).
- (Optional) Select a Comparison period if you wish to see data for your reporting period compared to another time range.
- Adjust the other filters and display options (these are specific to each report). Learn how to view classifications data in reports.
- Click Refresh to apply these changes to the report.
- Scroll down to view the report.
You can then export or print your report, or save it as a custom report (a new report you can access that retains the specific Reporting period, Comparison period and other display options you set).
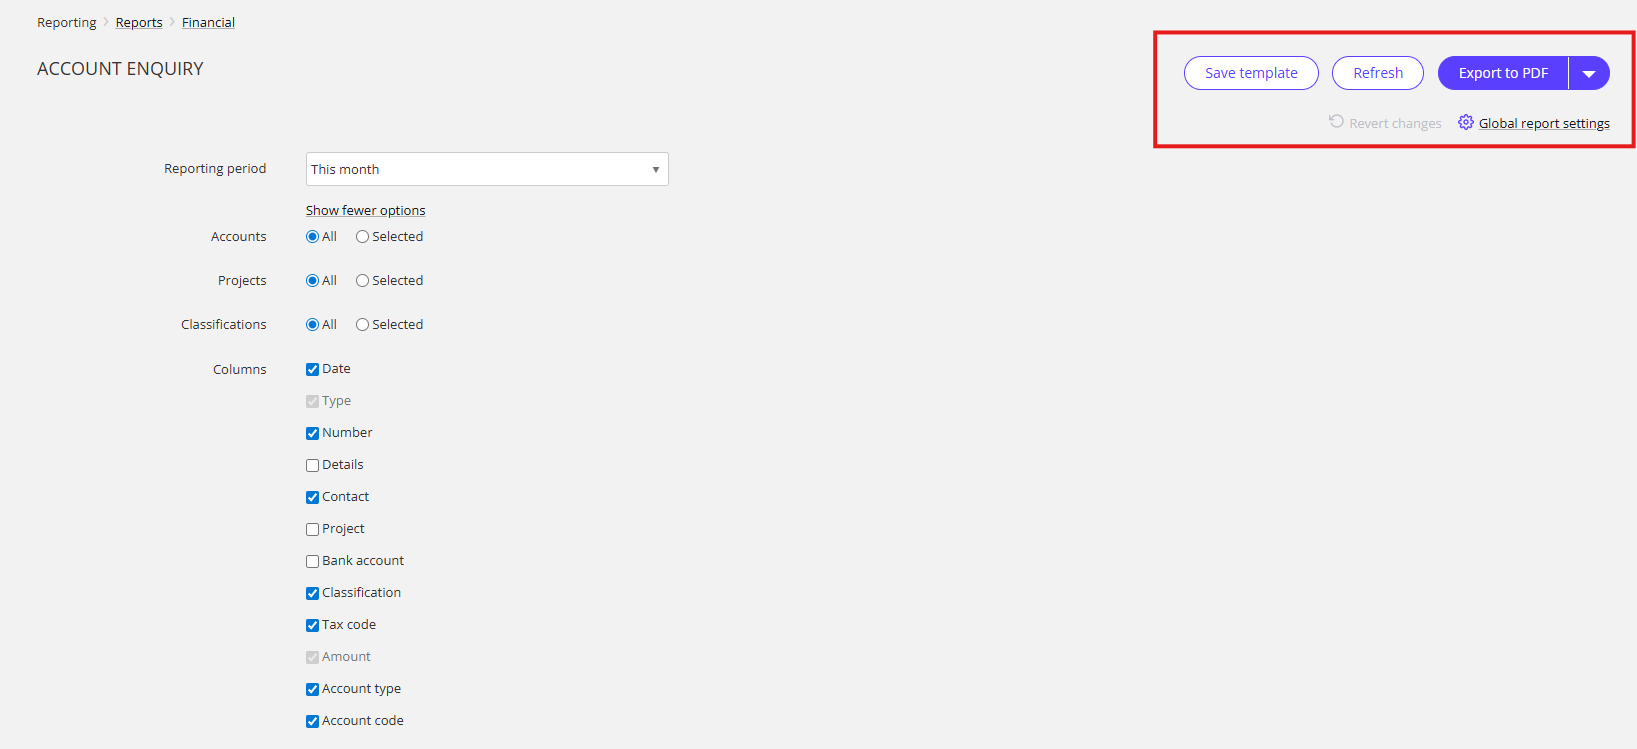
Export a report
To export a report:
- In the Reporting menu, select Reports.
- Click on the report you wish to export.
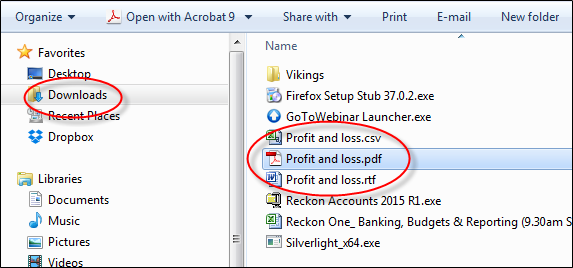
- Click Export to PDF, or click on the dropdown arrow and select your desired file format (CSV, XLSX, RTF).
- The report will download. Once completed, open the report from your browser or your computer's Downloads folder.
Print a report
To print a report, export to PDF format, open the file, and print.
Read more
- Learn how to save custom reports